TriggerProfiler.md
October 18, 2019 · View on GitHub
Diagnosing a WebAPI experiencing intermittent high CPU using the Application Insights Profiler
The Application Insights Profiler is a great tool to investigate code level performance problems. It collects traces every hour for two minutes allowing you to do proactive performance analysis of your applications. While proactive performance analysis is a very useful activity to reduce performance bottle necks in a steady state, it can be more challenging to use when the problem is reactive and intermittent in nature. In this tutorial, we will take a look at a new capability recently added - trigger based profiling that is very handy in those reactive scenarios.
Scenario Background
In this tutorial we will diagnose an application (DiagService) running in Azure App Services that is experiencing slowdowns due to intermittent high CPU conditions. We can see what the CPU activity for the application looks like by using the Application Insights metrics explorer and choosing the CPU metric.
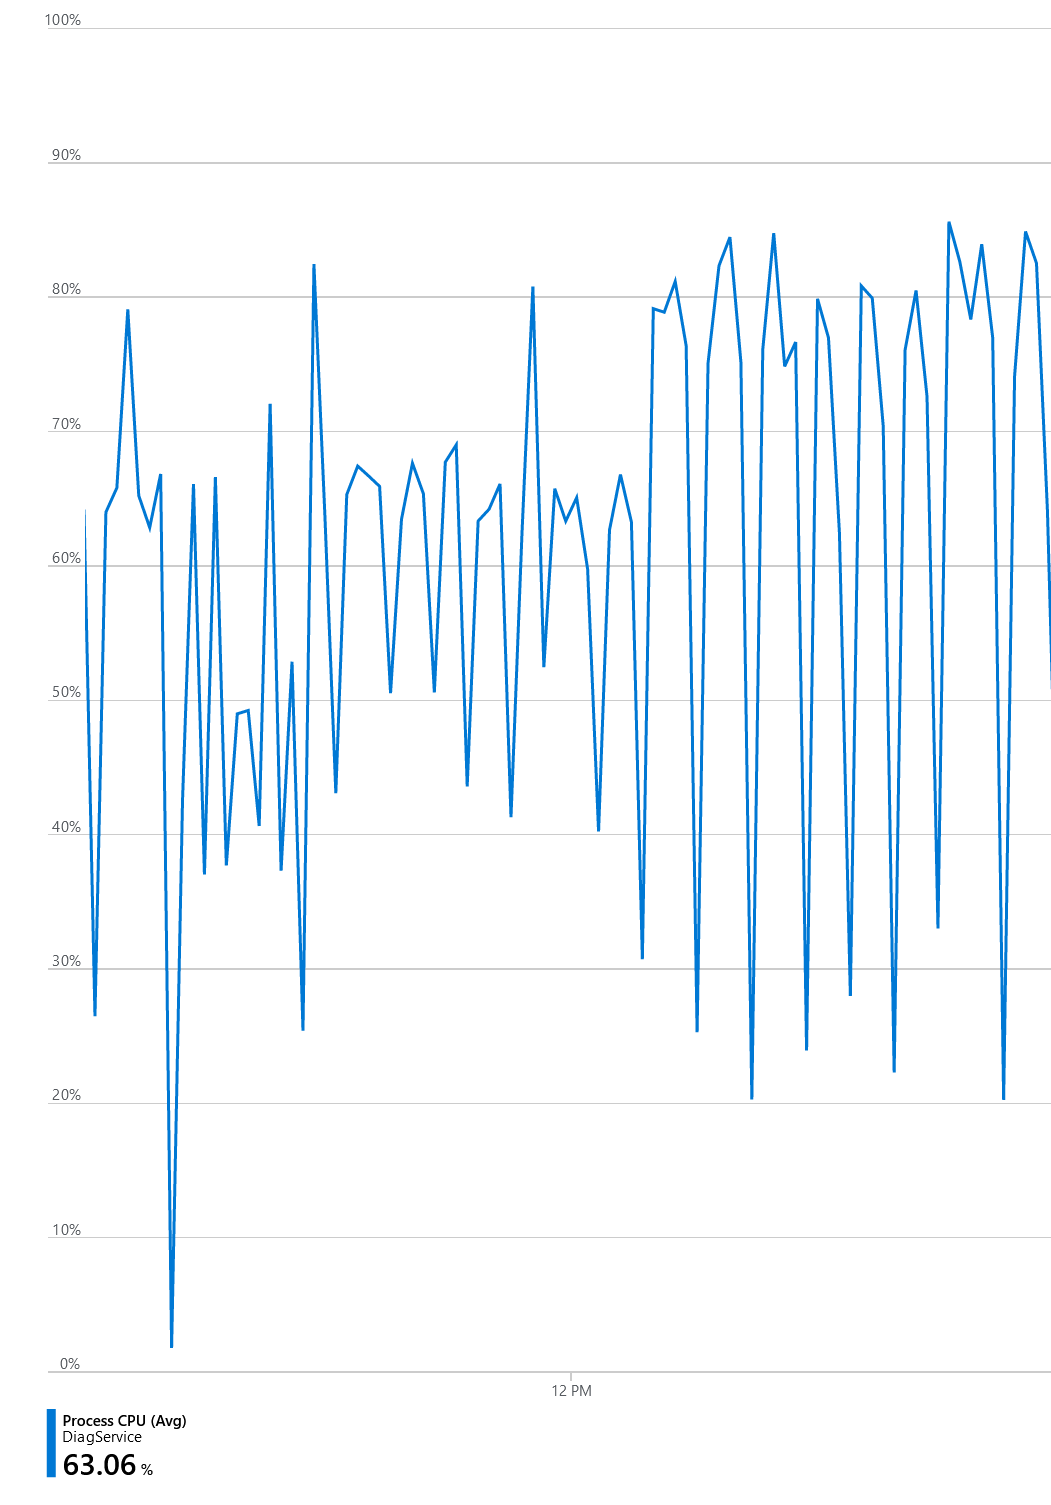
Here we can see that the average CPU consumption of our application is roughly 63%. What is interesting and presents a challenge is that the CPU tends to periodically spike to over 85% which is an unexpected behavior for our application. Our task now is to figure out what is causing those 85%+ CPU spikes.
Available Approaches
As mentioned earlier, the profiler automatically collects traces for 2 minutes every hour. The exact time window within the hour that the collection occurs can largely be viewed as random. For proactive performance analysis, over time, this gives a pretty good picture of the process activity. In this case though, we are interested in collecting traces only when CPU goes above 80% and hence, unless we get super lucky, we may never get profiler traces with the default collection plan.
Another approach is to utilize the on demand profiling capability which is available from the Configure Profiler blade as shown below.

This allows us to kick start a profiler session at any time we want. While this is a very useful approach it requires that you (1) know exactly when the problem surfaces and (2) the time window of the performance problem is large enough so that you have time to kick start the profiling session. In our case, the high CPU condition is intermittent and the spike fairly short leaving very little opportunity to use the Profile Now capability.
This brings us to the last approach known as trigger based profiling. With trigger based profiling you can specify conditions/thresholds that when breached automatically starts collecting profiler traces. Currently, the profiler supports CPU and memory based triggers. This is a perfect tool to use when faced with the symptoms our application is facing (intermittent and short high CPU spikes).
Configuring Triggers
The first thing we have to do is tell the profiler the conditions (triggers) that we want it to start collecting traces. From the performance blade, select the Configure Profiler to open the configuration blade. Next, we click the Triggers button shown below.

This opens up a new trigger configuration view:
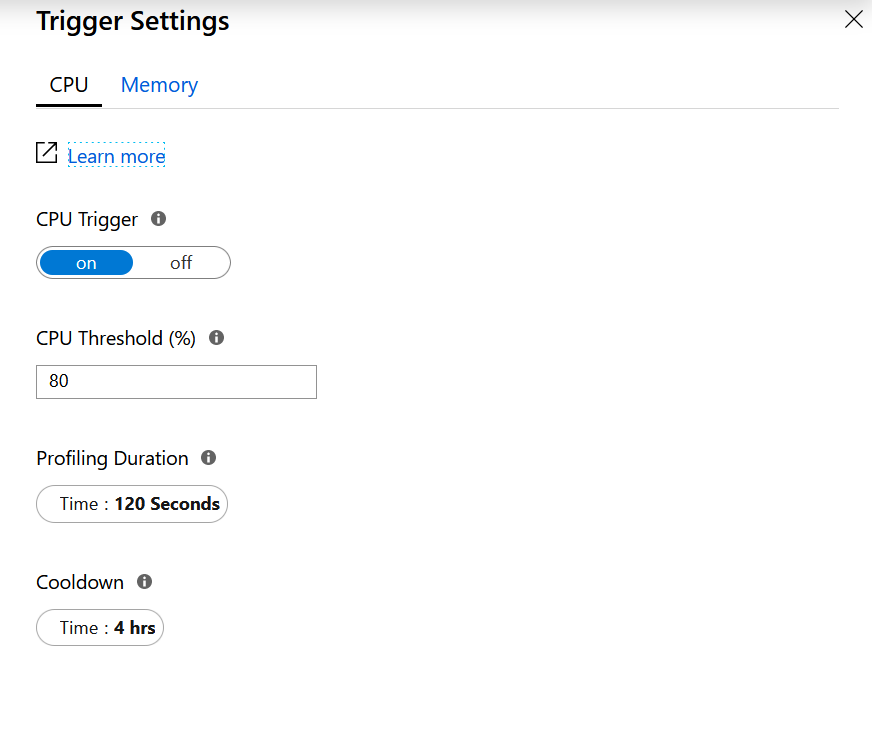
There are 4 different options that can be configured.
- CPU Trigger allows you to turn the enable or disable the trigger. The default value is on.
- CPU Threshold (%) allows you to specify the CPU threshold that has to be breached to start the profiling session. The default value is 80%.
- Profiling Duration allows you to specify the length of the profiling session once the threshold has been breached. The default value is 120 seconds (2 minutes).
- Cooldown allows you specify the amount of time that has to pass before another profiler session starts. The default value is 4 hrs.
Since we are interested in getting traces when the CPU breaches 85% we simply change the CPU Threshold value to 85 and leave the rest of the options as defaults. Next we click Apply.
At this point we have configured the Profiler to start collecting traces when the CPU breaches 85%.
Viewing Traces Generated From Triggers
At this point, we wait for the condition (85%+ CPU) to occur again and then turn our attention to the traces generated. The easiest way to view the generated traces is via the Configure Profiler button in the performance blade. On the configuration blade you will notice a list of available profiling sessions. To make it easier to understand whether a trace has been generated as a result of default sampling or a trigger a new column has been added called 'Triggered By' as shown below.
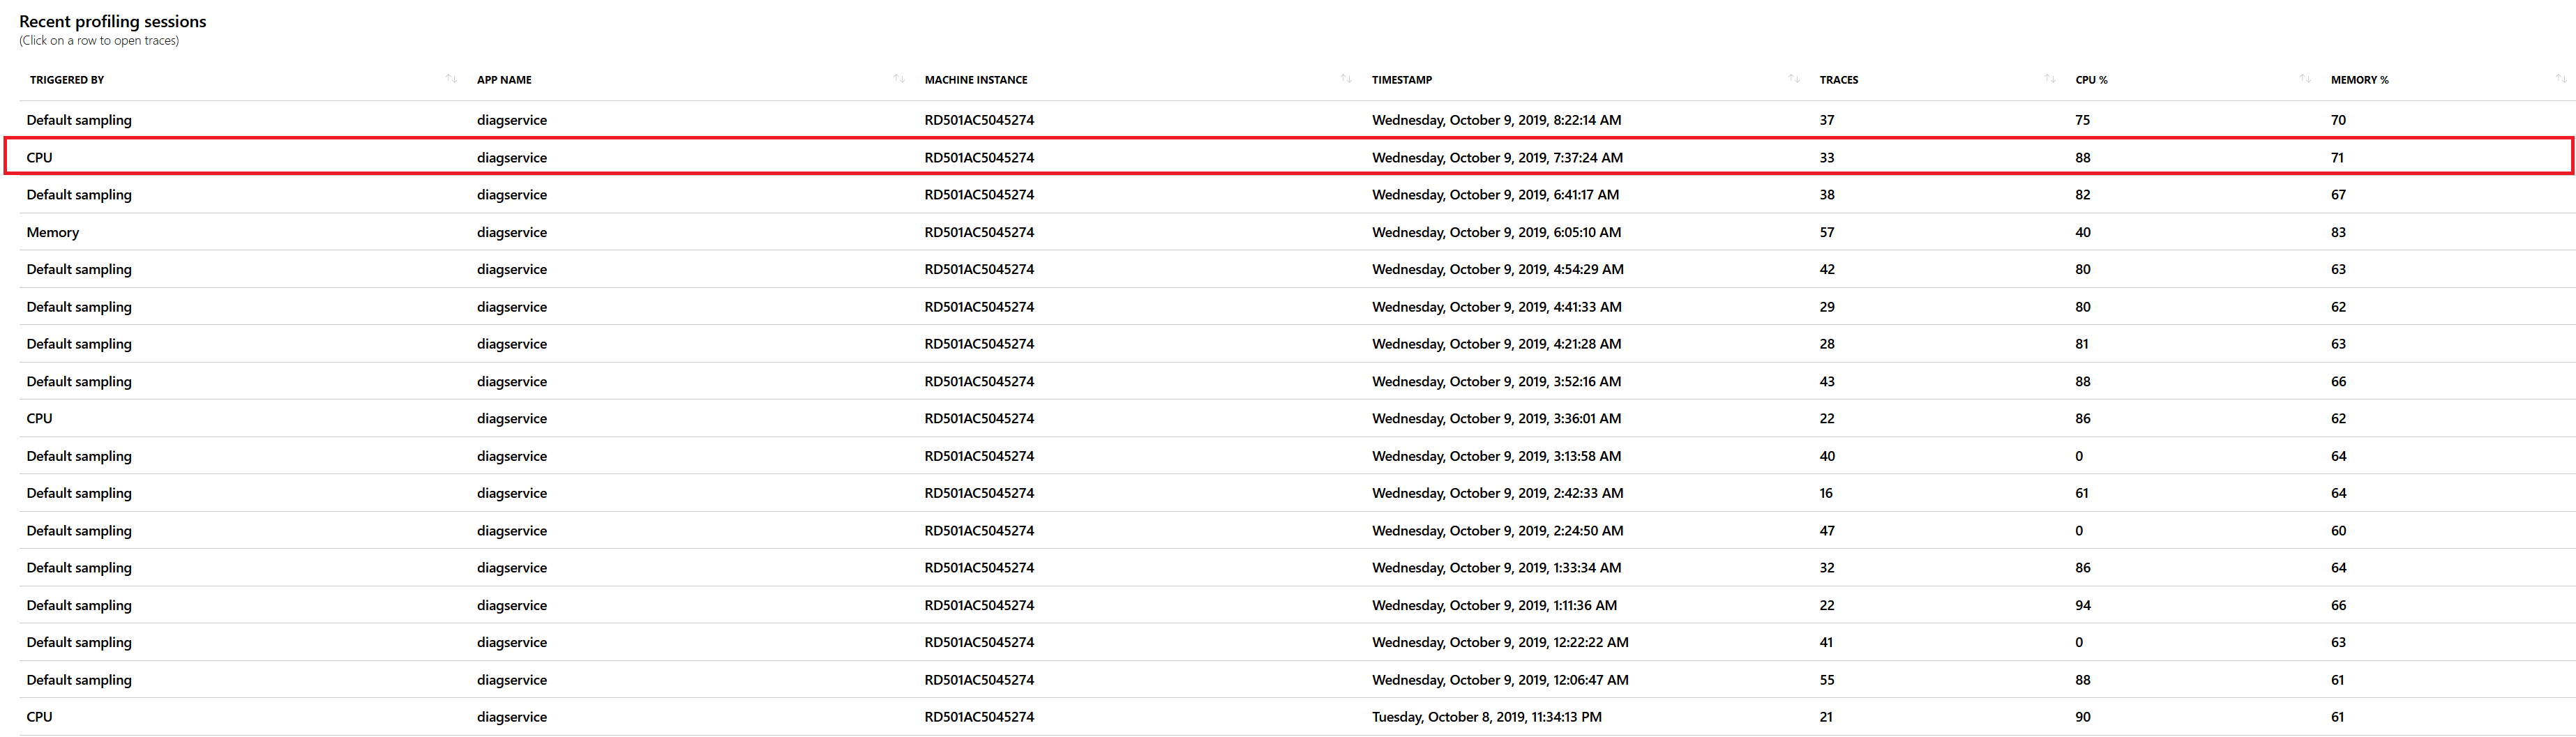
It also very conveniently tells you what the CPU and memory consumption was at the time of the profiler session. As you can see, a profiler session was started as a result of the previous CPU trigger that we configured. The CPU was at 88% and memory at 71%. We can now click on that row to open up the trace view blade and investigate further:
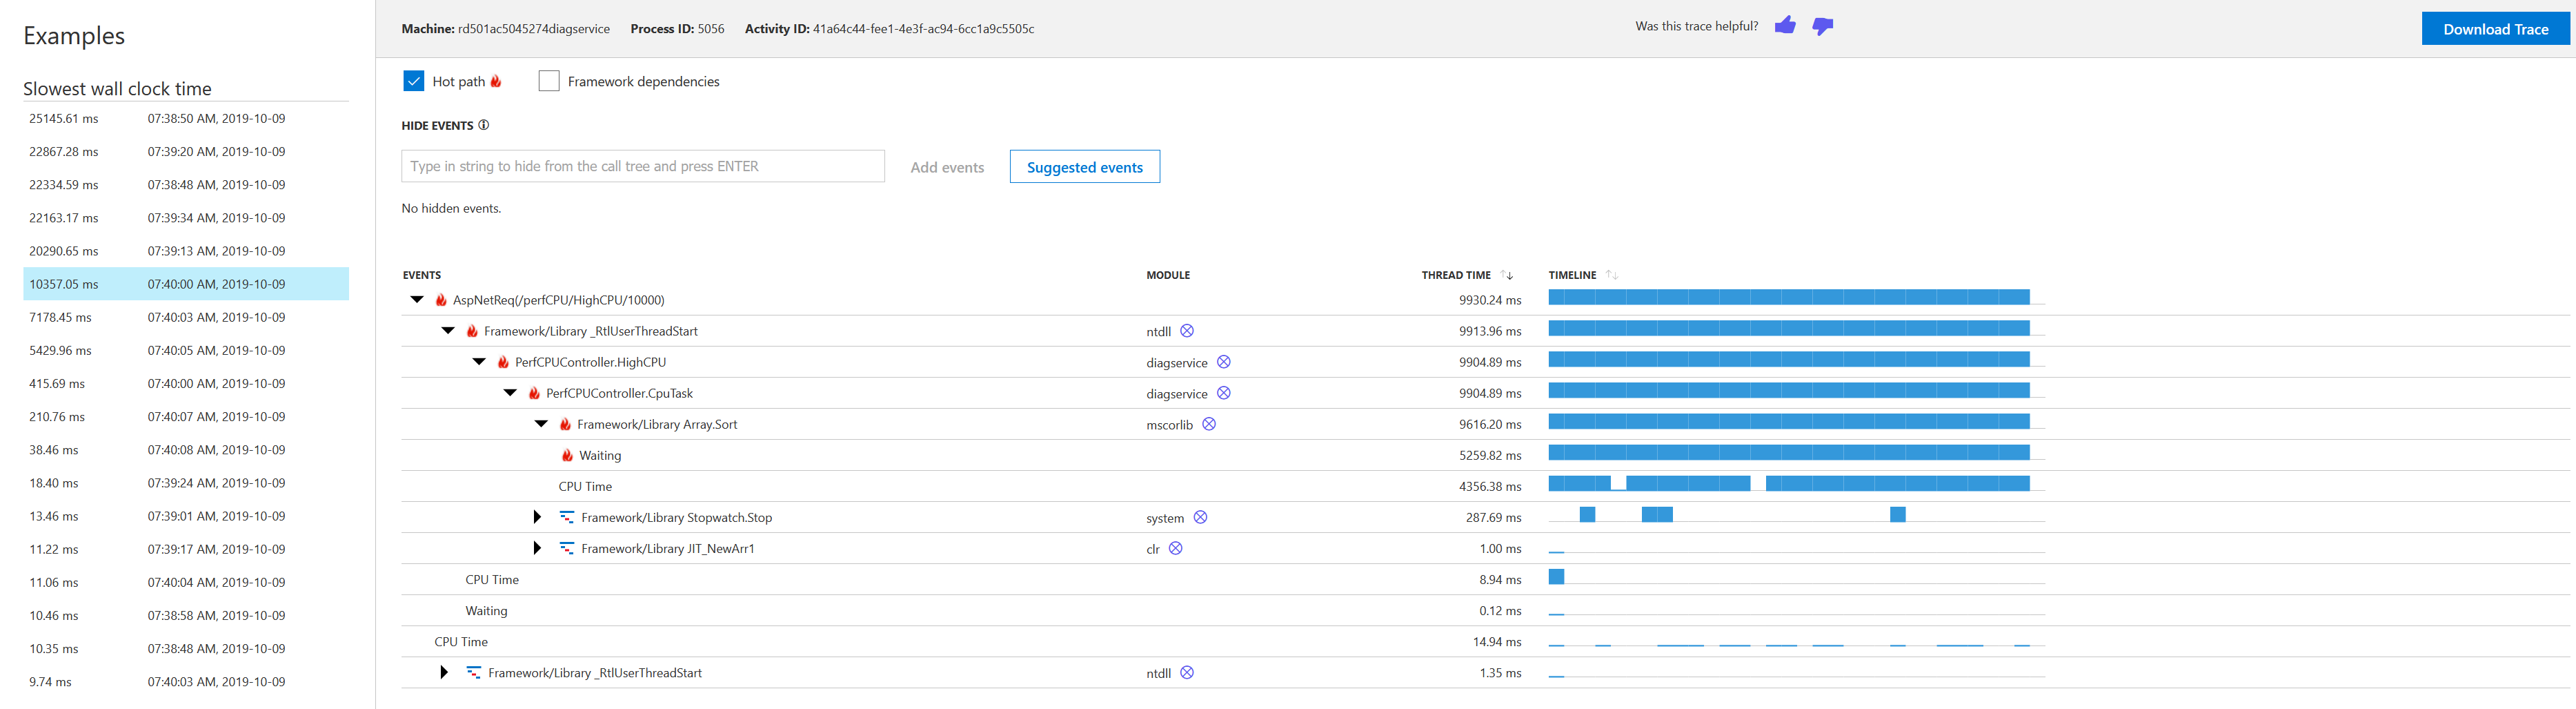
The above blade is split into two primary sections:
- Examples - shows a list of traces available in the session sorted by slowest wall clock time. You can pick individual traces to view.
- Trace view - shows the actual trace for the selected entry.
The trace offers a view of what was actually happening in code for that particular request. In the above case we can see that a request (/perfCPU/HighCPU/10000) was invoked and took 10 seconds to complete. If we look at the actual call tree, we can see that most of that time was taken in my controller doing a Sort of some kind. I can now switch over to my favorite code editor and look at that particular piece of code to see why the slowness occurred while sorting.