@capgo/capacitor-device-info
June 16, 2026 · View on GitHub

Production-ready Capacitor plugin for device diagnostics, support screens, QA tools, and in-app performance dashboards. Read CPU, memory, GPU, storage, thermal, low-power-mode, and onboard sensor data from iOS, Android, and Web with one snapshot call or a live interval stream.
Features
- One API for instant snapshots and live monitoring streams.
- No runtime permissions for the metrics currently exposed.
- Built for support/debug dashboards: identify low memory, storage pressure, low power mode, thermal state, GPU renderer, and hardware sensor availability.
- Listener-first streaming for charts:
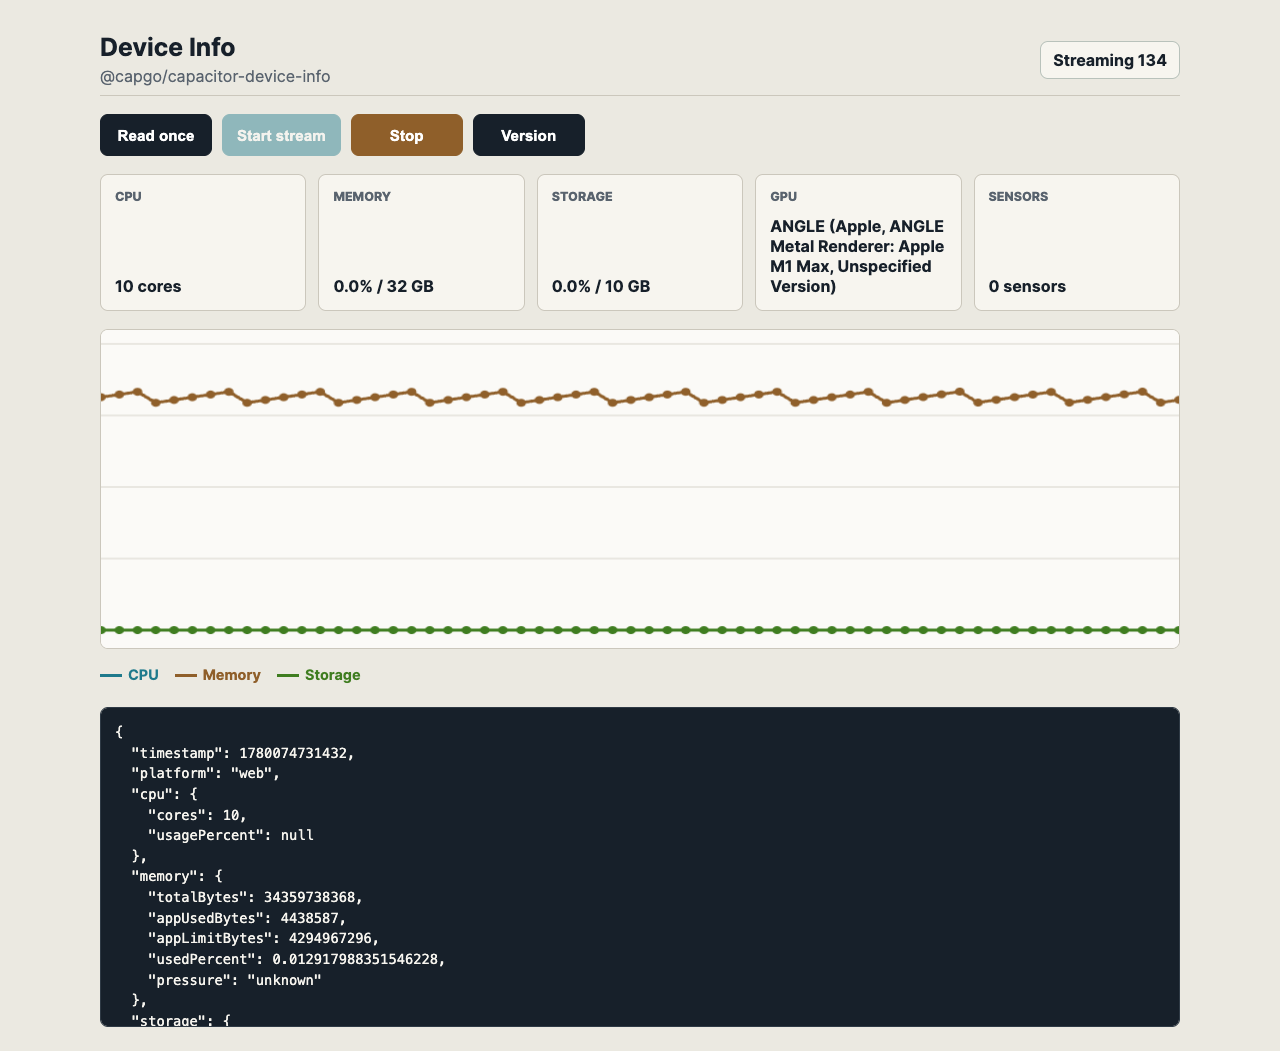
deviceInfoUpdateemits CPU, memory, storage, GPU, thermal, and sensor snapshots on a configurable interval. - Auto-stop streams by
durationMsorsampleCount. - Onboard sensor catalog with common readings when hardware exposes them: battery temperature, ambient temperature, relative humidity, pressure, light, and proximity.
- Native implementations: Metal, Mach, and CoreMotion availability on iOS; ActivityManager, StatFs,
/proc, OpenGL ES, SensorManager, and thermal zones on Android.
What You Can Read
| Area | Data |
|---|---|
| CPU | Core count, active cores, architecture, model, usage percent, max frequency, Android best-effort CPU temperature |
| Memory | Total/free/used bytes, used percent, app heap usage/limit, low-memory flag, pressure state |
| Storage | Total/free/used bytes and used percent for the app data volume |
| GPU | API, vendor, renderer, version, max texture size, Android best-effort GPU temperature |
| Power | Low power mode / battery saver state |
| Thermal | Platform thermal state: nominal, fair, serious, critical, or unknown |
| Sensors | Full onboard sensor list plus sampled readings for supported environmental/proximity sensors |
| Stream metadata | Sequence number, stream start timestamp, elapsed milliseconds |
Sensor Coverage
| Reading | iOS | Android | Web |
|---|---|---|---|
| Sensor availability list | CoreMotion sensor availability | SensorManager full sensor list | Empty fallback |
| CPU/GPU temperature | Not exposed by public iOS APIs | Best-effort thermal-zone reads | Not exposed |
| Battery temperature | Not exposed by public iOS APIs | ACTION_BATTERY_CHANGED | Not exposed |
| Ambient temperature | Not exposed | Sampled when TYPE_AMBIENT_TEMPERATURE exists | Not exposed |
| Relative humidity | Not exposed | Sampled when TYPE_RELATIVE_HUMIDITY exists | Not exposed |
| Pressure | Barometer availability | Sampled when TYPE_PRESSURE exists | Not exposed |
| Light | Not exposed | Sampled when TYPE_LIGHT exists | Not exposed |
| Proximity | Not exposed | Sampled when TYPE_PROXIMITY exists | Not exposed |
Sensor data is onboard-only. This plugin does not call weather services or fetch outside temperature/humidity from the network.
Common Use Cases
- Add a diagnostics panel to support tickets.
- Stream device metrics into an in-app performance graph.
- Detect low-memory or low-storage conditions before heavy work.
- Show hardware/GPU details when debugging device-specific rendering bugs.
- Log thermal and low-power state around slow sessions.
- Discover available sensors before enabling sensor-heavy features.
Compatibility
| Plugin version | Capacitor compatibility | Maintained |
|---|---|---|
| v8.*.* | v8.*.* | Yes |
| v7.*.* | v7.*.* | On demand |
| v6.*.* | v6.*.* | On demand |
Install
You can use our AI-Assisted Setup to install the plugin. Add the Capgo skills to your AI tool using the following command:
npx skills add https://github.com/cap-go/capacitor-skills --skill capacitor-plugins
Then use the following prompt:
Use the `capacitor-plugins` skill from `cap-go/capacitor-skills` to install the `@capgo/capacitor-device-info` plugin in my project.
If you prefer Manual Setup, install the plugin by running the following commands and follow the platform-specific instructions below:
npm install @capgo/capacitor-device-info
npx cap sync
Usage
import { DeviceInfo } from '@capgo/capacitor-device-info';

const snapshot = await DeviceInfo.getInfo();
console.log(snapshot.cpu.cores, snapshot.memory.usedPercent);

const handle = await DeviceInfo.addListener('deviceInfoUpdate', (sample) => {
  console.log(sample.sequence, sample.cpu.usagePercent, sample.memory.usedPercent);
});

await DeviceInfo.startMonitoring({
  intervalMs: 1000,
  durationMs: 60_000,
  emitImmediately: true,
});

await DeviceInfo.stopMonitoring();
await handle.remove();
CPU usage is calculated from deltas, so the first native sample may omit cpu.usagePercent. Periodic monitoring fills it after the second sample when the platform exposes CPU ticks.
Platform Notes
- iOS requires no permissions for the metrics exposed here. GPU data comes from Metal, CPU and memory data comes from Mach APIs, and sensor availability comes from CoreMotion checks. iOS public APIs do not expose raw CPU/GPU temperature.
- Android requires no permissions. GPU data is queried from a short-lived OpenGL ES context and then cached. CPU/GPU temperatures are best-effort thermal-zone reads and may be omitted on restricted devices.
- Web support is best effort. Browser APIs expose CPU cores, storage quota, JS heap on Chromium, and WebGL GPU strings when allowed.
Example App
The example-app/ folder links to the plugin with file:.. and includes an interval listener chart.
cd example-app
npm install
npm run start
API
Capacitor plugin contract for reading device CPU, memory, GPU, storage, and onboard sensor metrics.
getInfo()
getInfo() => Promise<DeviceInfoSnapshot>
Read one CPU, memory, GPU, storage, thermal, and onboard sensor snapshot.
Returns: Promise<DeviceInfoSnapshot>
Since: 8.0.0
startMonitoring(...)
startMonitoring(options?: MonitoringOptions | undefined) => Promise<StartMonitoringResult>
Start periodic device snapshots.
Listen to deviceInfoUpdate to receive samples. Calling this while monitoring
is already active restarts monitoring with the new options.
| Param | Type |
|---|---|
options | MonitoringOptions |
Returns: Promise<StartMonitoringResult>
Since: 8.0.0
stopMonitoring()
stopMonitoring() => Promise<StopMonitoringResult>
Stop periodic device snapshots.
Returns: Promise<StopMonitoringResult>
Since: 8.0.0
isMonitoring()
isMonitoring() => Promise<MonitoringState>
Return current periodic monitoring state.
Returns: Promise<MonitoringState>
Since: 8.0.0
addListener('deviceInfoUpdate', ...)
addListener(eventName: 'deviceInfoUpdate', listenerFunc: (event: DeviceInfoUpdate) => void) => Promise<PluginListenerHandle>
Listen for periodic device snapshots.
| Param | Type | Description |
|---|---|---|
eventName | 'deviceInfoUpdate' | Only the deviceInfoUpdate event is supported. |
listenerFunc | (event: DeviceInfoUpdate) => void | Callback invoked with each snapshot. |
Returns: Promise<PluginListenerHandle>
Since: 8.0.0
removeAllListeners()
removeAllListeners() => Promise<void>
Remove all listeners that have been registered on the plugin.
Since: 8.0.0
getPluginVersion()
getPluginVersion() => Promise<PluginVersionResult>
Get the native Capacitor plugin version.
Returns: Promise<PluginVersionResult>
Since: 8.0.0
Interfaces
DeviceInfoSnapshot
Instant device snapshot returned by {@link DeviceInfoPlugin.getInfo}.
| Prop | Type | Description | Since |
|---|---|---|---|
timestamp | number | Snapshot timestamp as Unix epoch milliseconds. | 8.0.0 |
platform | 'ios' | 'android' | 'web' | Platform implementation that produced the snapshot. | 8.0.0 |
cpu | CpuInfo | CPU information and usage. | 8.0.0 |
memory | MemoryInfo | Memory information and usage. | 8.0.0 |
storage | StorageInfo | Storage information and usage. | 8.0.0 |
gpu | GpuInfo | GPU information when the platform exposes it. | 8.0.0 |
thermalState | ThermalState | Thermal state when the platform exposes it. | 8.0.0 |
lowPowerMode | boolean | Low-power mode state when the platform exposes it. | 8.0.0 |
sensors | OnboardSensorsInfo | Onboard sensor availability and readings. | 8.0.0 |
CpuInfo
CPU snapshot for the current device.
All frequency values are reported in hertz. usagePercent is null when a
platform needs at least two samples to calculate CPU usage.
| Prop | Type | Description | Since |
|---|---|---|---|
cores | number | Total logical CPU cores visible to the app. | 8.0.0 |
activeCores | number | Logical CPU cores currently active, when the platform exposes it. | 8.0.0 |
architecture | string | CPU architecture, for example arm64 or x86_64. | 8.0.0 |
model | string | CPU or SoC model identifier when available. | 8.0.0 |
usagePercent | number | null | System CPU usage from 0 to 100. | 8.0.0 |
maxFrequencyHz | number | Highest CPU frequency exposed by the platform. | 8.0.0 |
temperatureCelsius | number | CPU temperature in Celsius when the platform exposes an onboard thermal sensor. Android reads this as a best-effort value from device thermal zones. iOS does not expose raw CPU temperature through public APIs. | 8.0.0 |
MemoryInfo
Memory snapshot for the current device and app process.
All size values are reported in bytes.
| Prop | Type | Description | Since |
|---|---|---|---|
totalBytes | number | Total physical memory on the device. | 8.0.0 |
freeBytes | number | Memory available to the system. | 8.0.0 |
usedBytes | number | Memory currently used by the system. | 8.0.0 |
usedPercent | number | Memory usage from 0 to 100. | 8.0.0 |
appUsedBytes | number | Memory used by the current app process. | 8.0.0 |
appLimitBytes | number | Heap limit visible to the current app process. | 8.0.0 |
lowMemory | boolean | Whether the OS currently reports low-memory pressure. | 8.0.0 |
pressure | 'normal' | 'warning' | 'critical' | 'unknown' | Platform memory pressure label. | 8.0.0 |
StorageInfo
Storage snapshot for the app data volume.
All size values are reported in bytes.
| Prop | Type | Description | Since |
|---|---|---|---|
totalBytes | number | Total bytes on the app data volume. | 8.0.0 |
freeBytes | number | Free bytes on the app data volume. | 8.0.0 |
usedBytes | number | Used bytes on the app data volume. | 8.0.0 |
usedPercent | number | Storage usage from 0 to 100. | 8.0.0 |
GpuInfo
GPU snapshot for the primary graphics device.
| Prop | Type | Description | Since |
|---|---|---|---|
api | 'unknown' | 'metal' | 'opengl' | 'webgl' | Graphics API used to query the GPU. | 8.0.0 |
vendor | string | GPU vendor when available. | 8.0.0 |
renderer | string | GPU renderer or model name when available. | 8.0.0 |
version | string | Graphics API version string when available. | 8.0.0 |
maxTextureSize | number | Maximum texture size reported by the graphics API. | 8.0.0 |
temperatureCelsius | number | GPU temperature in Celsius when the platform exposes an onboard thermal sensor. Android reads this as a best-effort value from device thermal zones. iOS does not expose raw GPU temperature through public APIs. | 8.0.0 |
OnboardSensorsInfo
Onboard sensors snapshot.
This only reports hardware sensors exposed by the device or operating system. It does not fetch weather data or any external temperature/humidity source.
| Prop | Type | Description | Since |
|---|---|---|---|
availableSensors | OnboardSensorDescriptor[] | Sensors available to the app. | 8.0.0 |
readings | OnboardSensorReading[] | Instant sensor readings captured for common environmental sensors. | 8.0.0 |
batteryTemperatureCelsius | number | Battery temperature in Celsius when available. | 8.0.0 |
ambientTemperatureCelsius | number | Ambient air temperature from an onboard sensor in Celsius when available. | 8.0.0 |
relativeHumidityPercent | number | Relative humidity from an onboard sensor as a percentage when available. | 8.0.0 |
pressureHpa | number | Atmospheric pressure from an onboard barometer in hectopascals when available. | 8.0.0 |
illuminanceLux | number | Ambient light from an onboard light sensor in lux when available. | 8.0.0 |
proximityDistanceCm | number | Proximity distance from an onboard proximity sensor in centimeters when available. | 8.0.0 |
OnboardSensorDescriptor
Description of an onboard hardware sensor exposed by the platform.
| Prop | Type | Description | Since |
|---|---|---|---|
type | string | Stable sensor type label, for example pressure, ambientTemperature, or accelerometer. | 8.0.0 |
name | string | Platform sensor name when available. | 8.0.0 |
vendor | string | Sensor vendor when available. | 8.0.0 |
platformType | number | Android sensor type id when available. | 8.0.0 |
maximumRange | number | Maximum sensor range when available. | 8.0.0 |
resolution | number | Sensor resolution when available. | 8.0.0 |
powerMilliamp | number | Sensor power draw in milliamps when available. | 8.0.0 |
minDelayMicroseconds | number | Minimum sensor delay in microseconds when available. | 8.0.0 |
wakeUp | boolean | Whether this is a wake-up sensor when available. | 8.0.0 |
OnboardSensorReading
Instant onboard sensor reading.
| Prop | Type | Description | Since |
|---|---|---|---|
type | string | Stable sensor type label. | 8.0.0 |
unit | string | Human-readable unit, for example celsius, percent, hPa, lux, or cm. | 8.0.0 |
value | number | Sensor value. | 8.0.0 |
name | string | Platform sensor name when available. | 8.0.0 |
timestamp | number | Reading timestamp as Unix epoch milliseconds. | 8.0.0 |
StartMonitoringResult
Result returned when monitoring starts.
| Prop | Type | Description | Since |
|---|---|---|---|
monitoring | boolean | Whether monitoring is active. | 8.0.0 |
intervalMs | number | Effective interval in milliseconds. | 8.0.0 |
startedAt | number | Monitoring start timestamp as Unix epoch milliseconds. | 8.0.0 |
MonitoringOptions
Options used to start periodic device snapshots.
| Prop | Type | Description | Since |
|---|---|---|---|
intervalMs | number | Time between samples in milliseconds. Values below 250ms are clamped to 250ms to avoid excessive native work. Defaults to 1000ms. | 8.0.0 |
durationMs | number | Stop automatically after this duration in milliseconds. | 8.0.0 |
sampleCount | number | Stop automatically after this number of emitted samples. | 8.0.0 |
emitImmediately | boolean | Emit one sample immediately when monitoring starts. Defaults to true. | 8.0.0 |
StopMonitoringResult
Result returned by {@link DeviceInfoPlugin.stopMonitoring}.
| Prop | Type | Description | Since |
|---|---|---|---|
monitoring | boolean | Whether monitoring remains active after the stop request. | 8.0.0 |
MonitoringState
Current monitoring state.
| Prop | Type | Description | Since |
|---|---|---|---|
monitoring | boolean | Whether monitoring is active. | 8.0.0 |
intervalMs | number | Effective interval in milliseconds when monitoring is active. | 8.0.0 |
startedAt | number | Monitoring start timestamp as Unix epoch milliseconds. | 8.0.0 |
samplesEmitted | number | Number of samples emitted by the active monitoring session. | 8.0.0 |
PluginListenerHandle
| Prop | Type |
|---|---|
remove | () => Promise<void> |
DeviceInfoUpdate
Periodic event payload emitted while monitoring is active.
| Prop | Type | Description | Since |
|---|---|---|---|
sequence | number | One-based sample sequence for the active monitoring session. | 8.0.0 |
startedAt | number | Monitoring start timestamp as Unix epoch milliseconds. | 8.0.0 |
elapsedMs | number | Elapsed milliseconds since monitoring started. | 8.0.0 |
PluginVersionResult
Plugin version payload.
| Prop | Type | Description | Since |
|---|---|---|---|
version | string | Version identifier returned by the platform implementation. | 8.0.0 |
Type Aliases
ThermalState
Thermal state reported by the platform.
'nominal' | 'fair' | 'serious' | 'critical' | 'unknown'