Gallery of Statistical Analysis
June 16, 2023 · View on GitHub
A series of Jupyter Notebooks are provided to demonstrate various types of statistical analysis that can be applied to the tracking outputs.
1. Maps
MCS track density maps (South America):
- MCS track density (annual):

- MCS initiation counts (DJF):
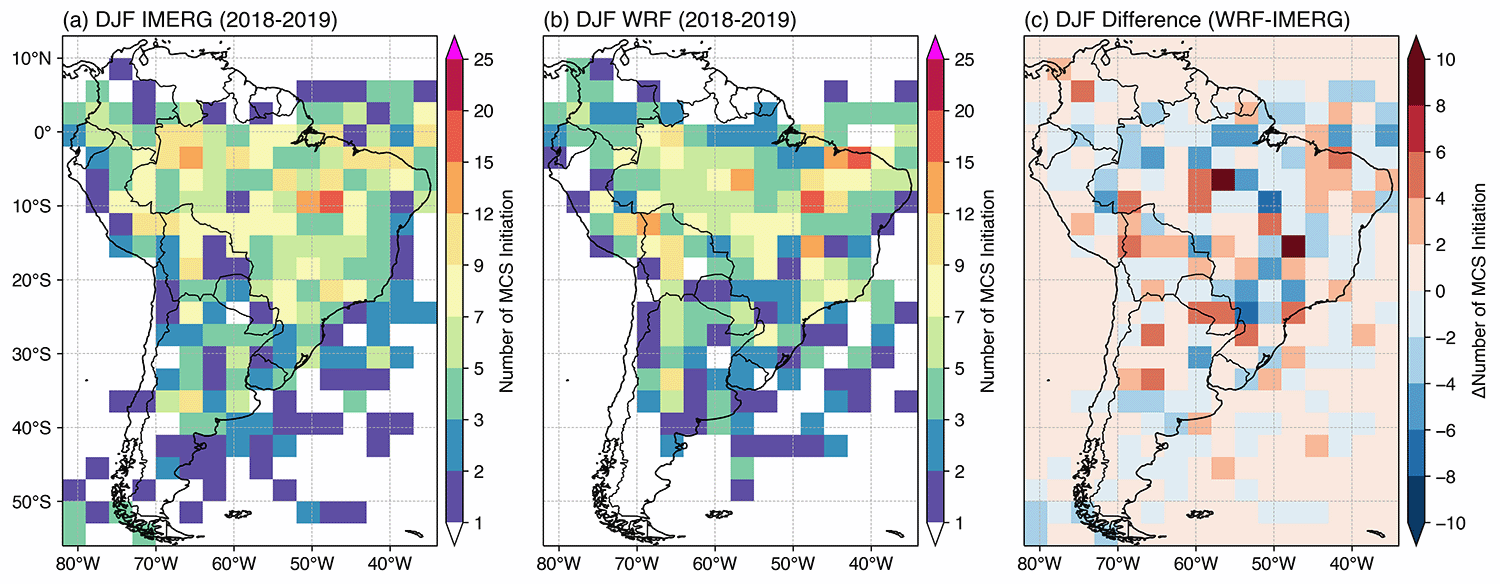
MCS track density maps by season (Central U.S.):
- MCS track density (JJA):

- MCS initiation counts (JJA):

MCS precipitation maps:
- MCS rain amount (annual):
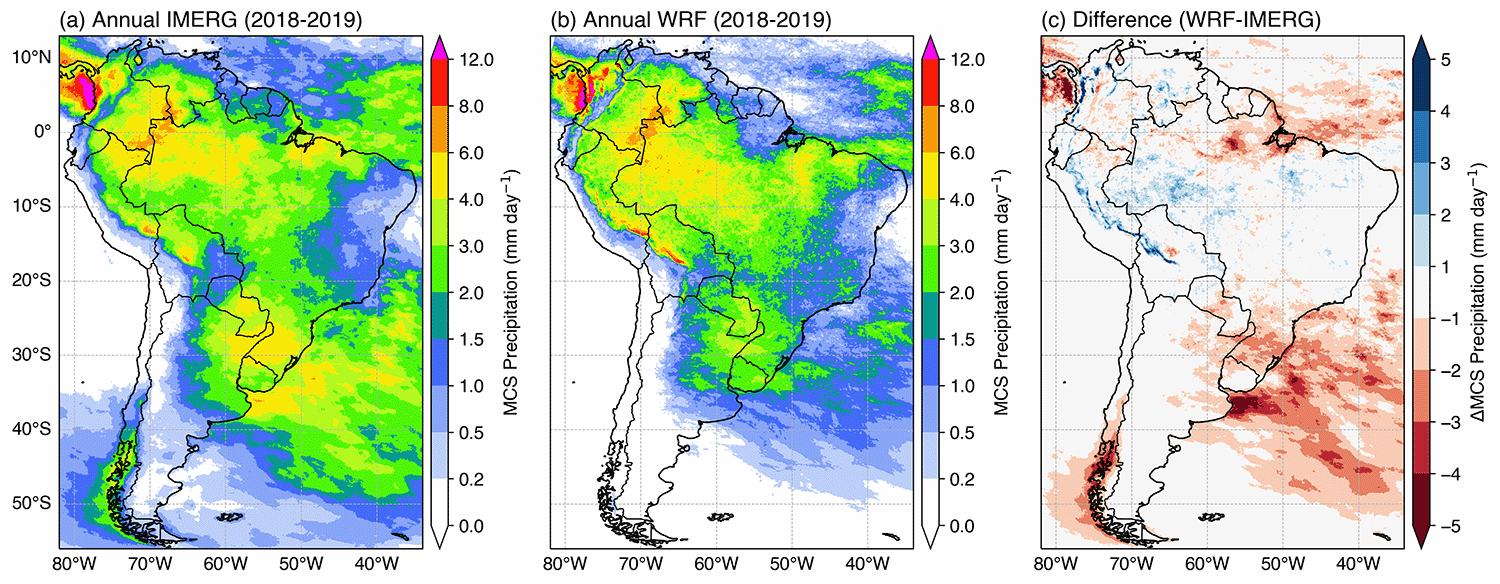
- MCS rain fraction (annual):
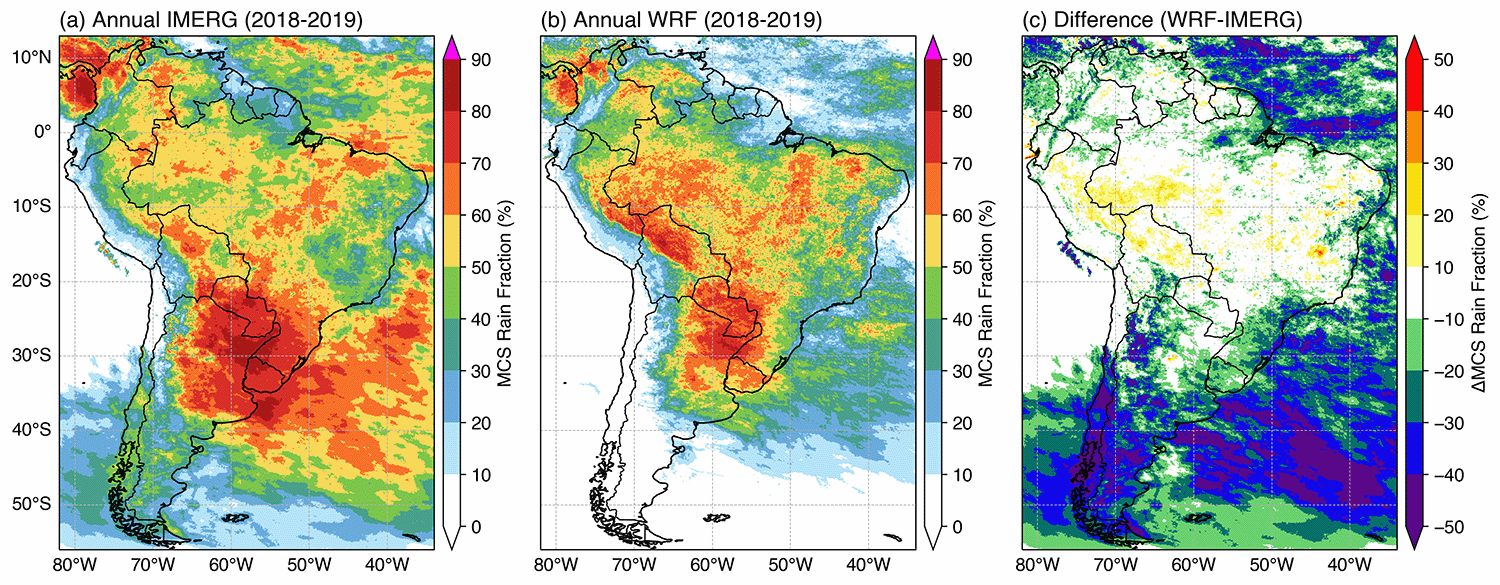
- MCS rain frequency (annual):
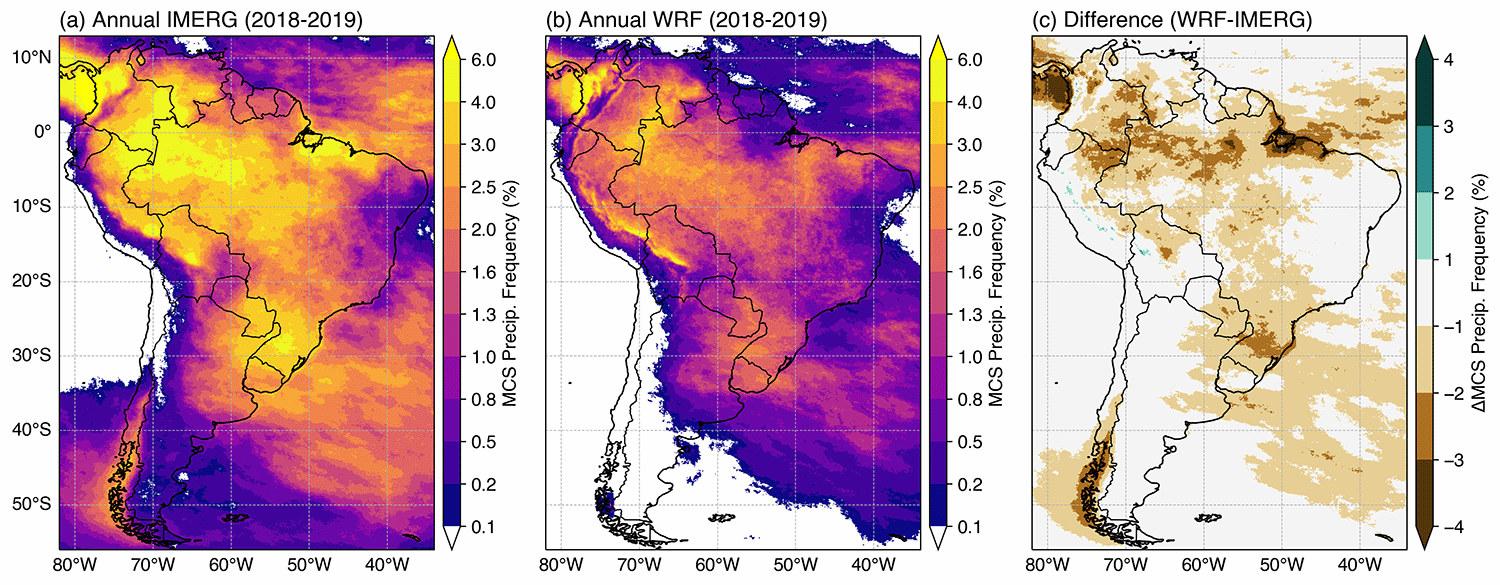
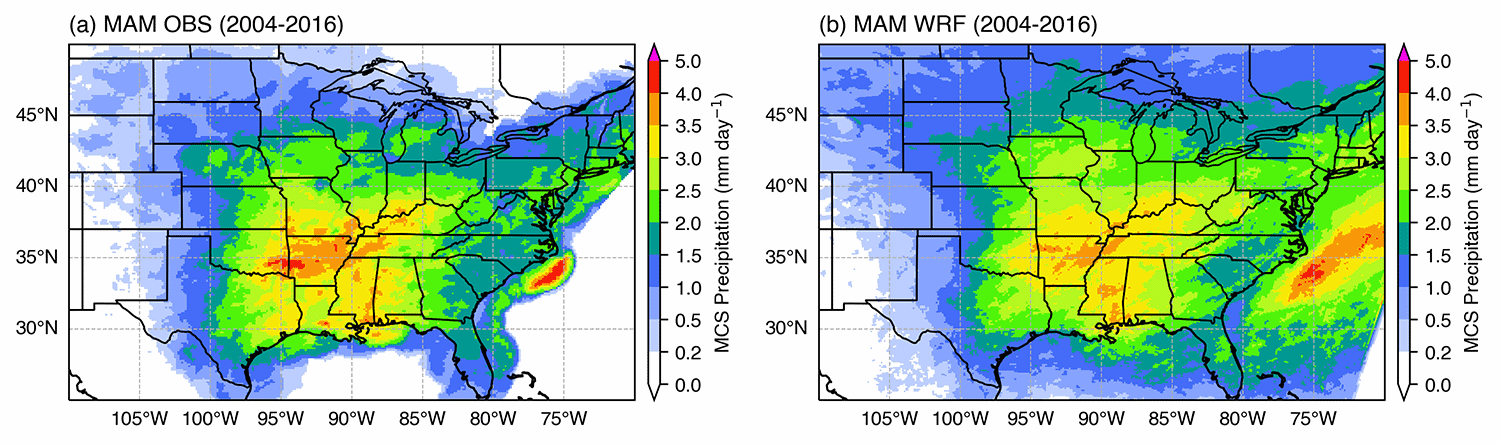
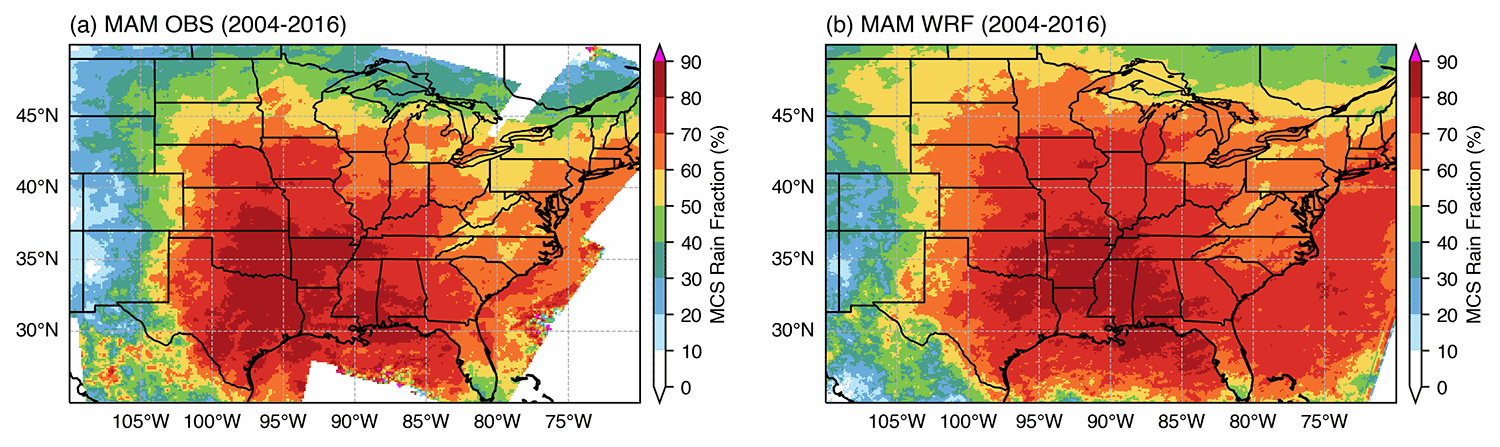
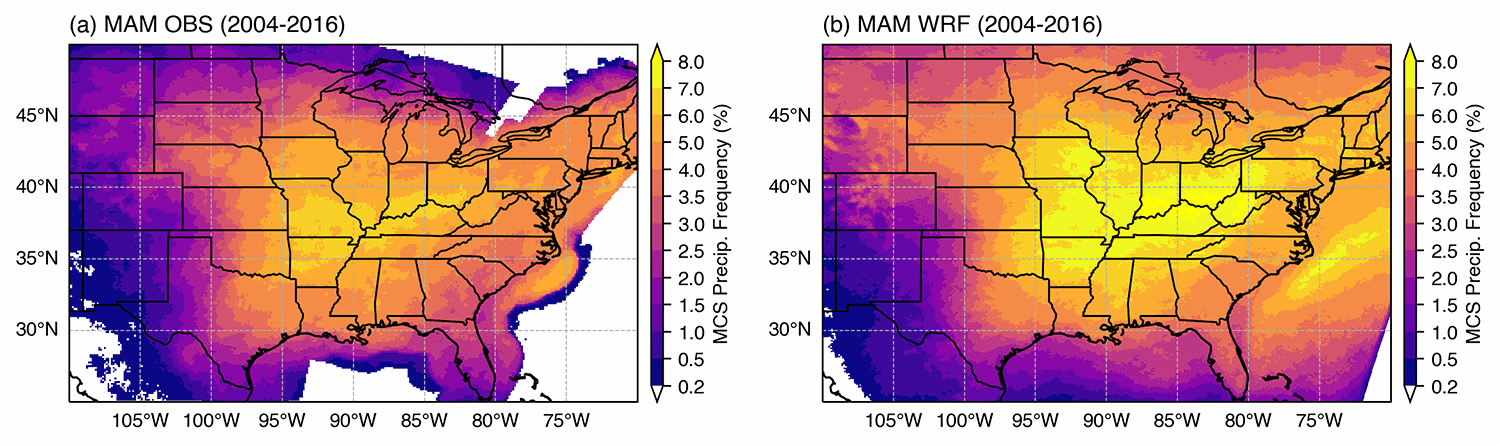
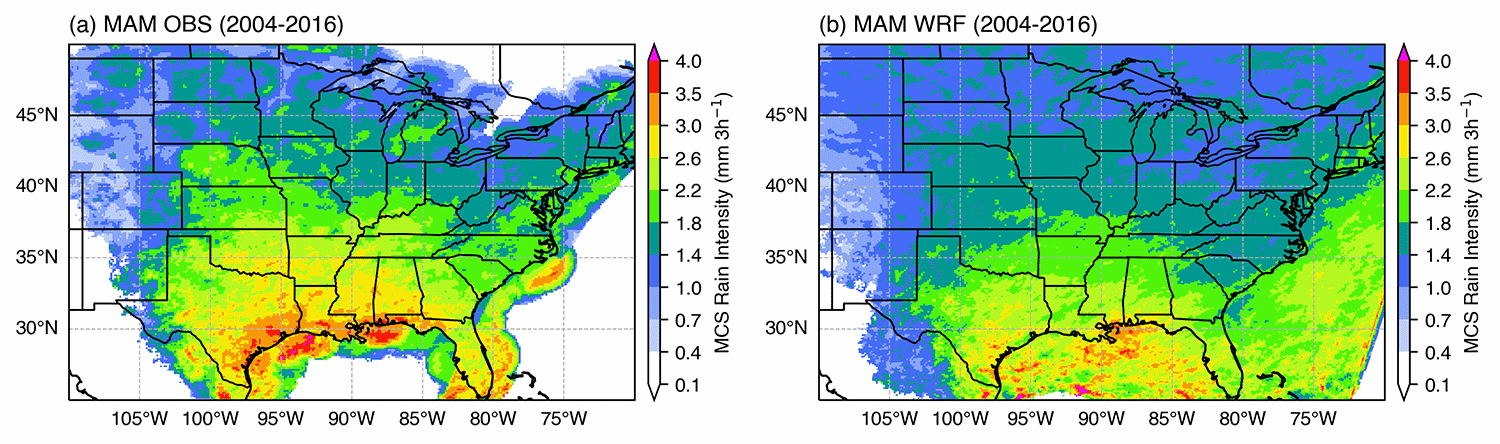
MCS precipitation maps (no differencing):
- MCS rain amount (MAM):
- MCS rain fraction (MAM):
- MCS rain frequency (MAM):
- MCS rain intensity (MAM):
2. Track Properties
MCS track properties (by season):
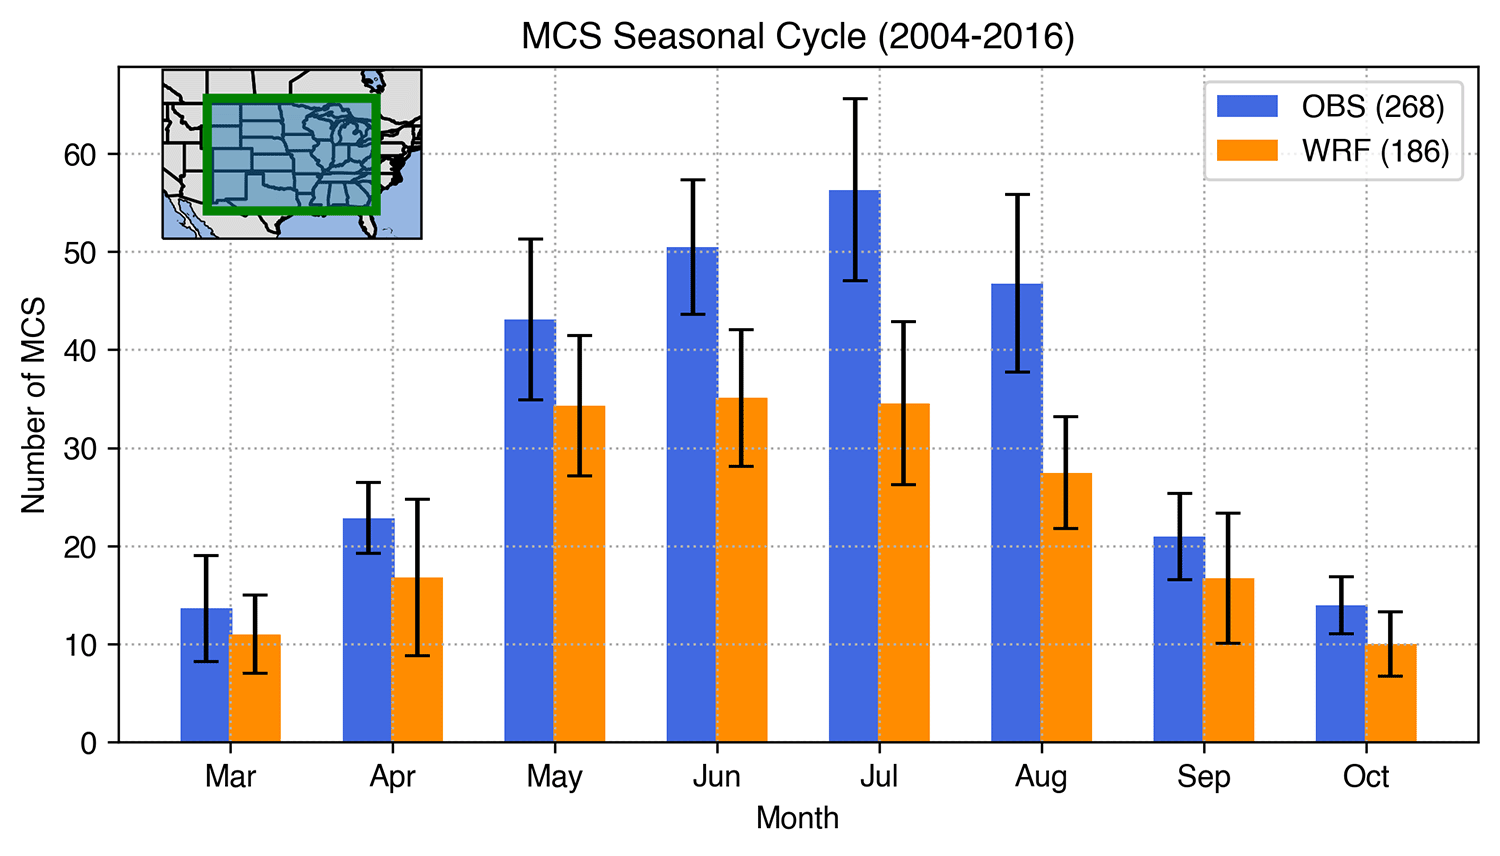
- MCS number seasonal cycle with interannual variability:
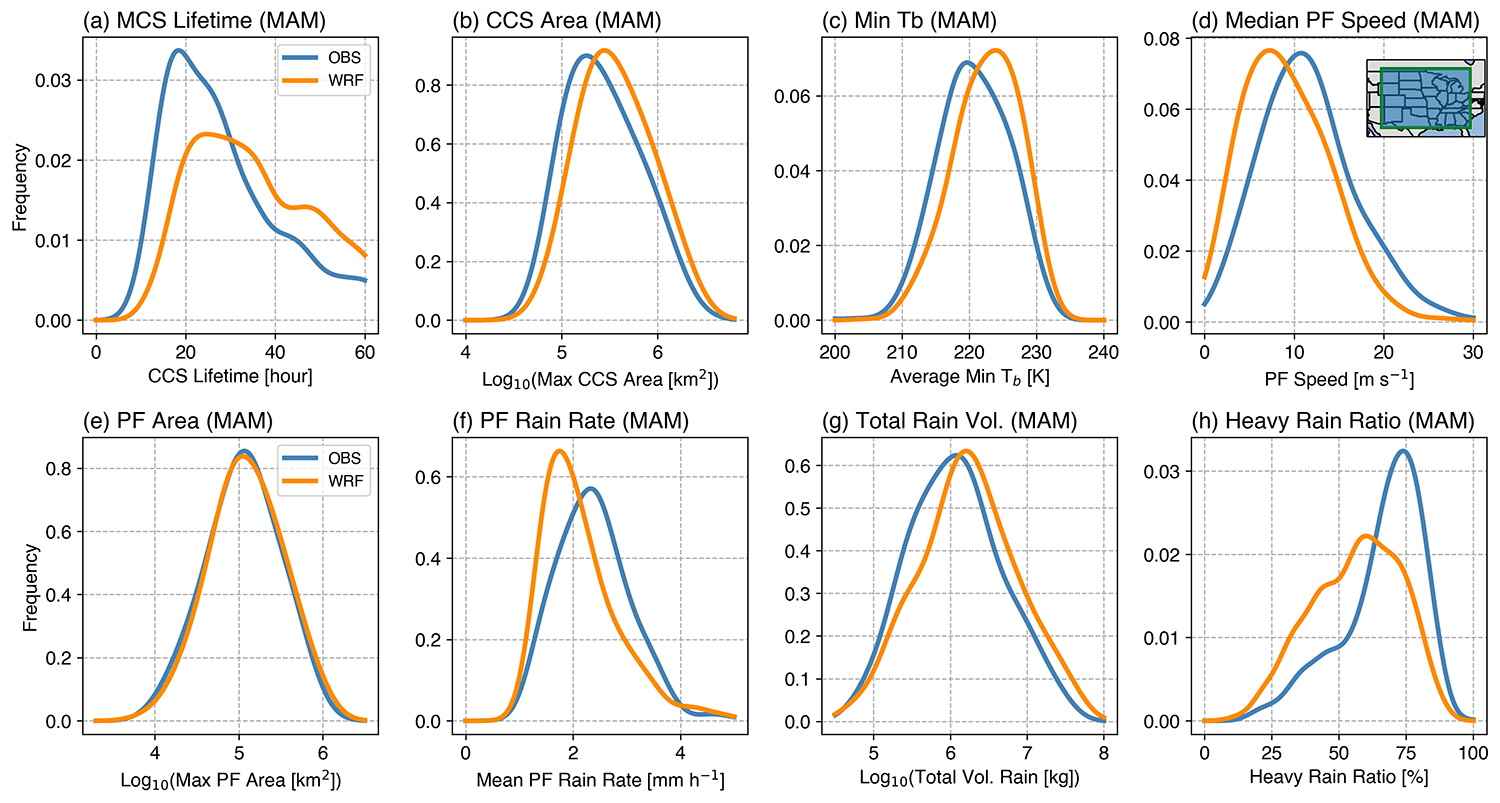
- MCS property PDFs:
MCS track properties (land vs. ocean):
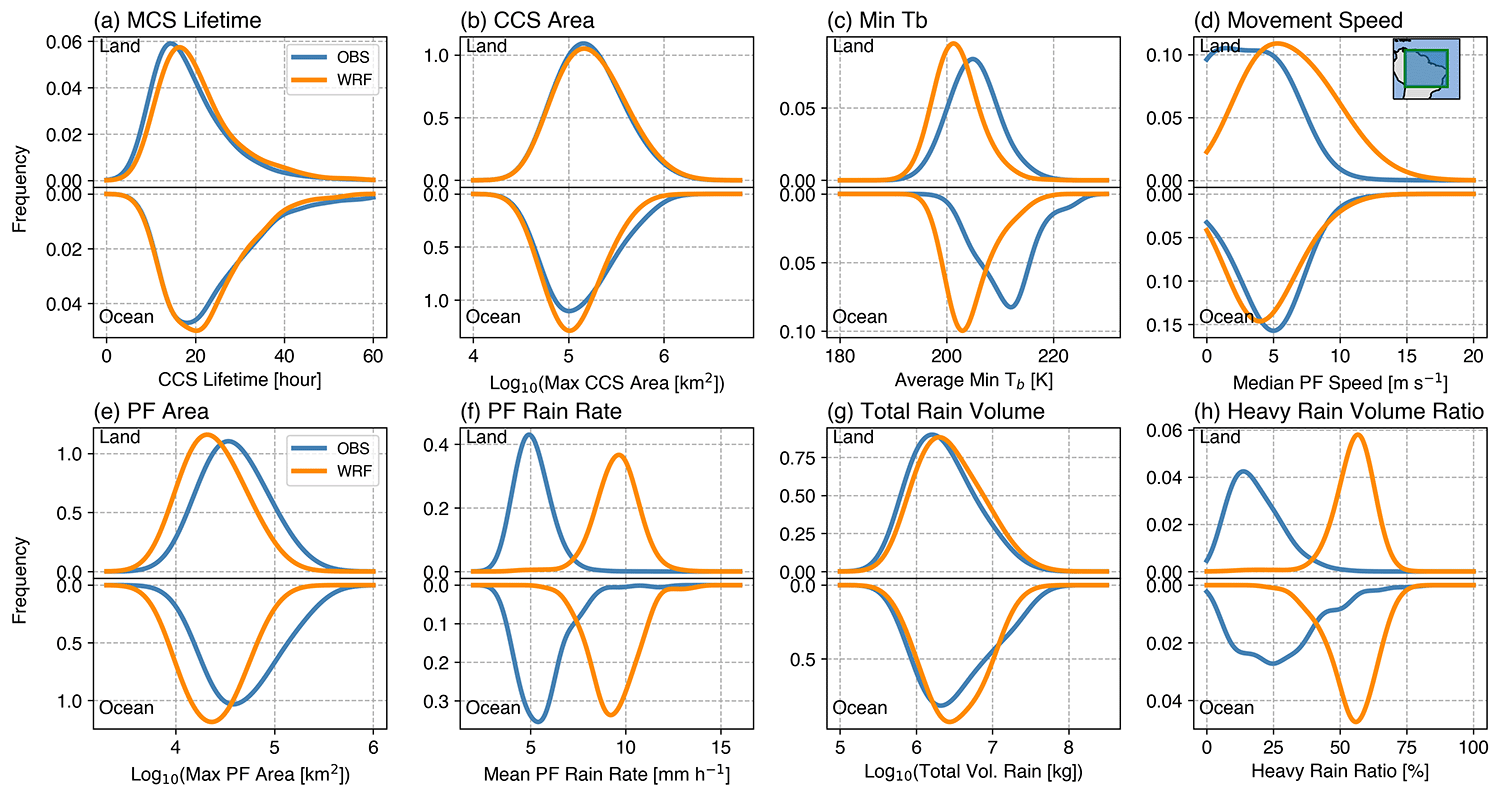
- MCS property PDFs (land [top] vs. ocean [bottom]):
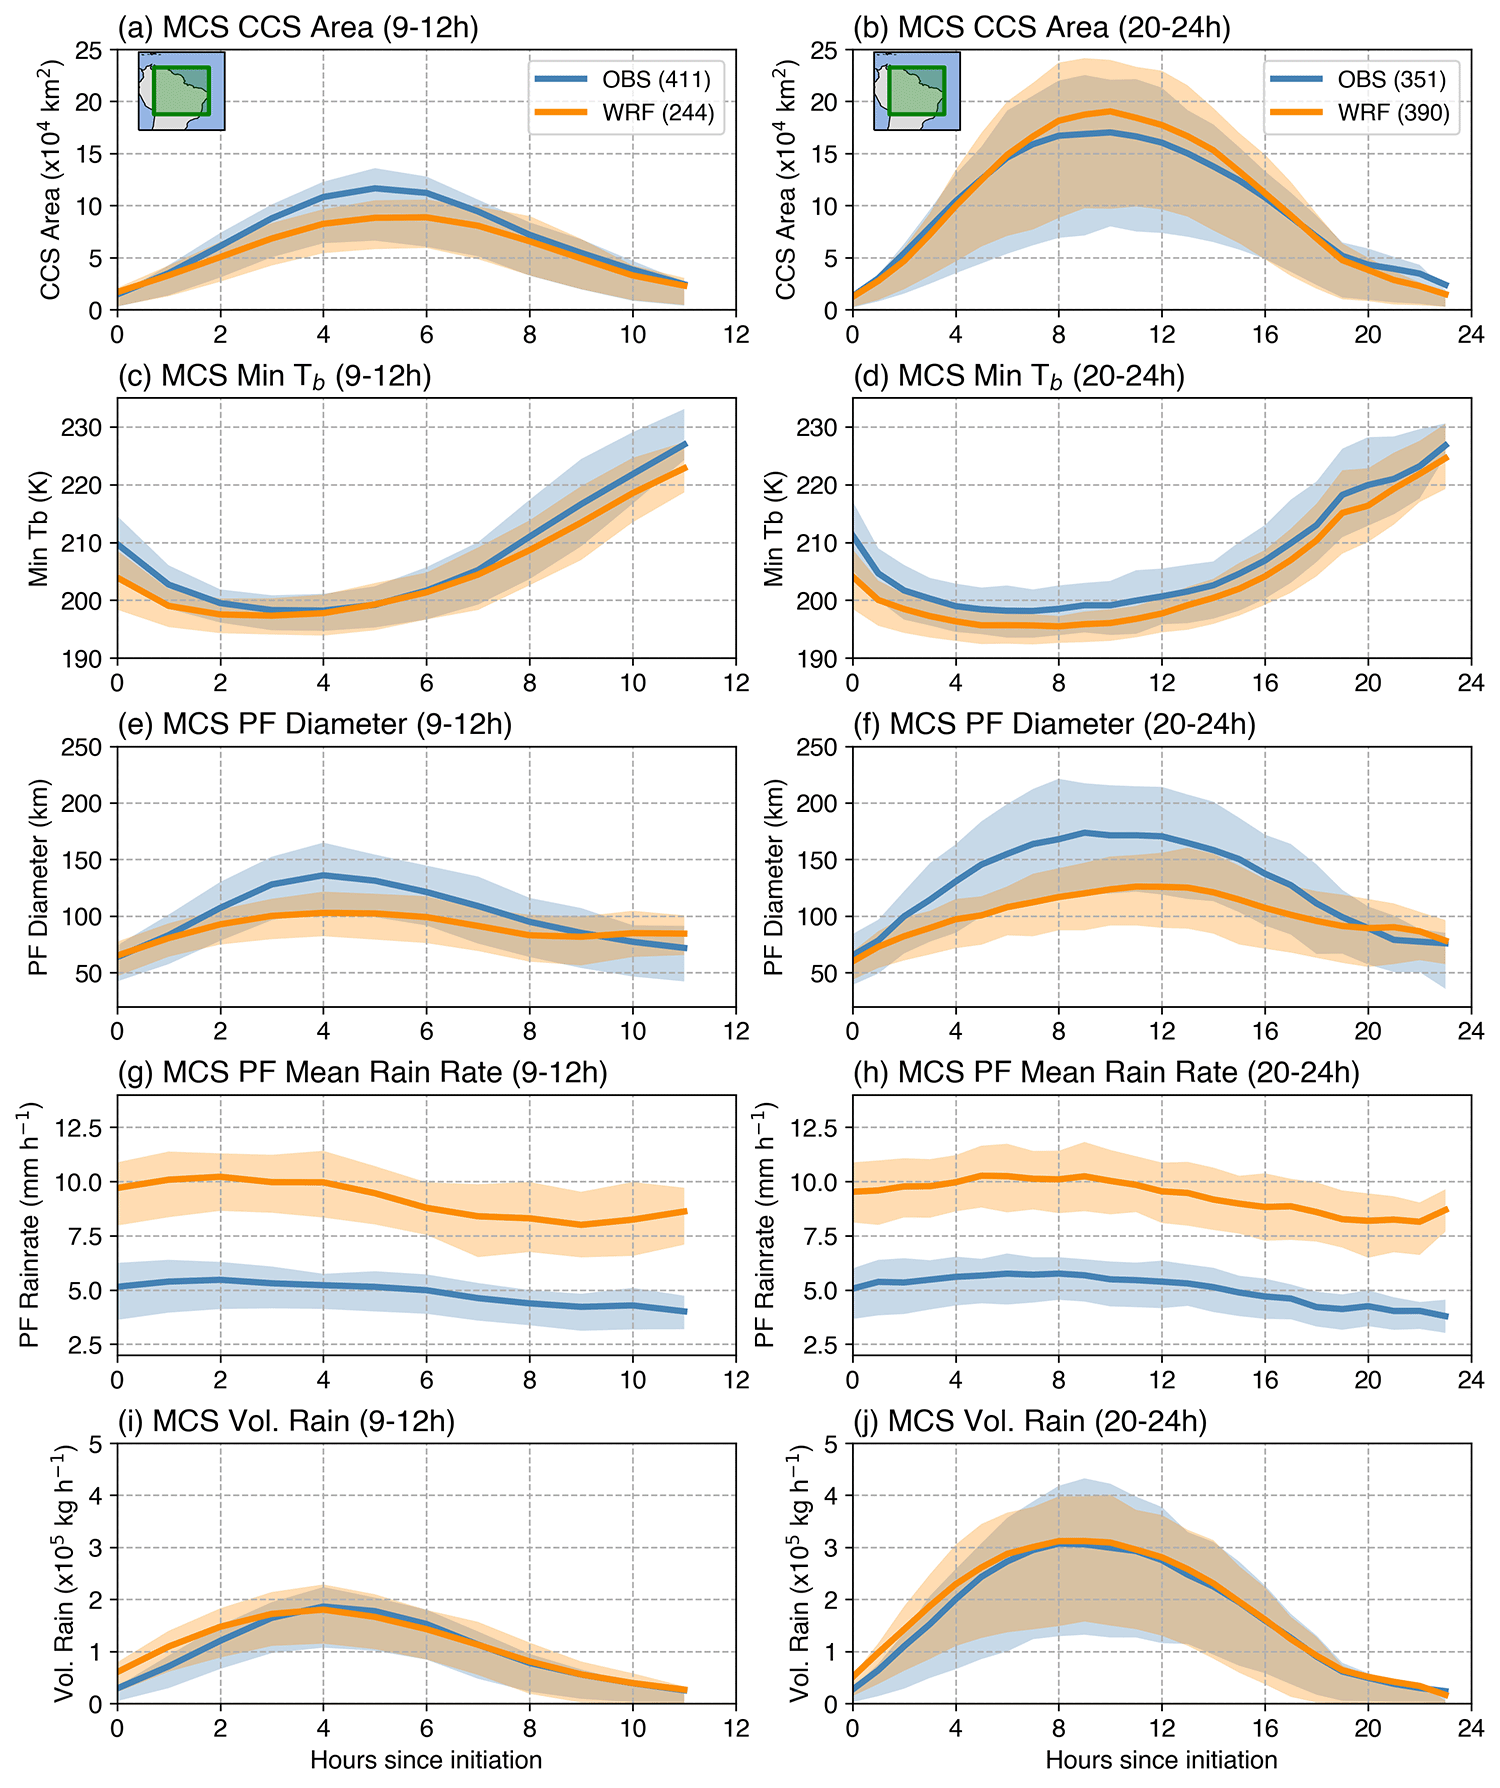
- Composite lifecycle evolution for short-lived vs. long-lived MCS:
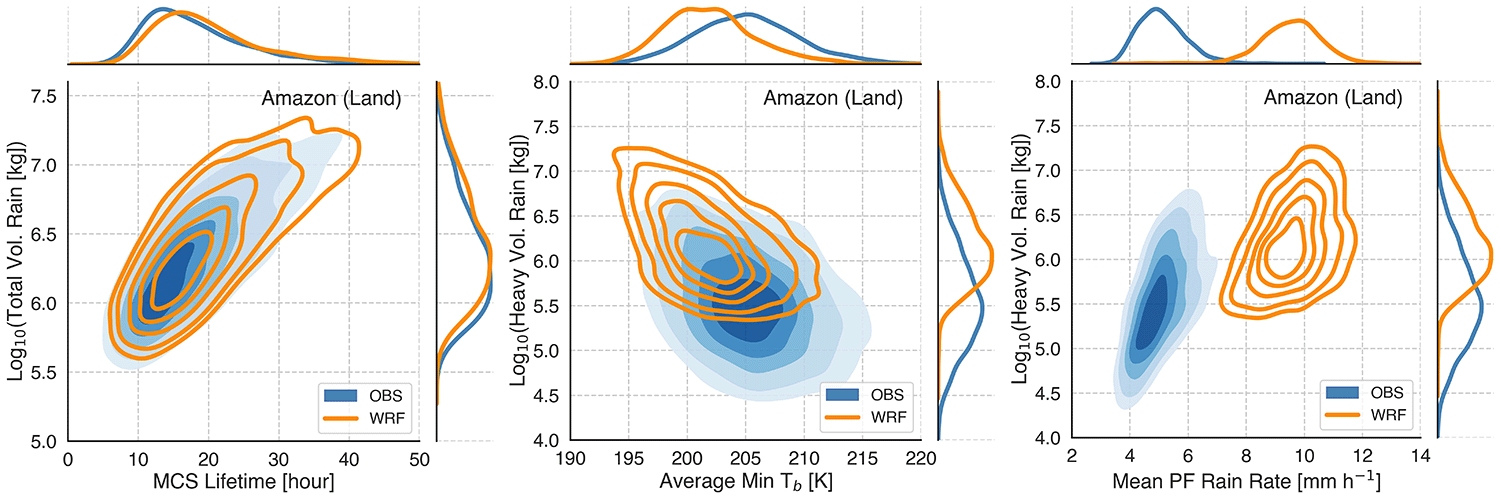
- MCS joint kernel density estimates:
3. Diurnal Cycle
MCS precipitation diurnal cycle:
- Precipitation Hovmoller diagram:

- MCS vs. non-MCS precipitation diurnal cycle:
