🖥️ HWInfo TUI
December 1, 2025 · View on GitHub





A terminal plotting tool for visualizing real-time hardware sensor data from HWInfo64 (Windows), inspired by gping.
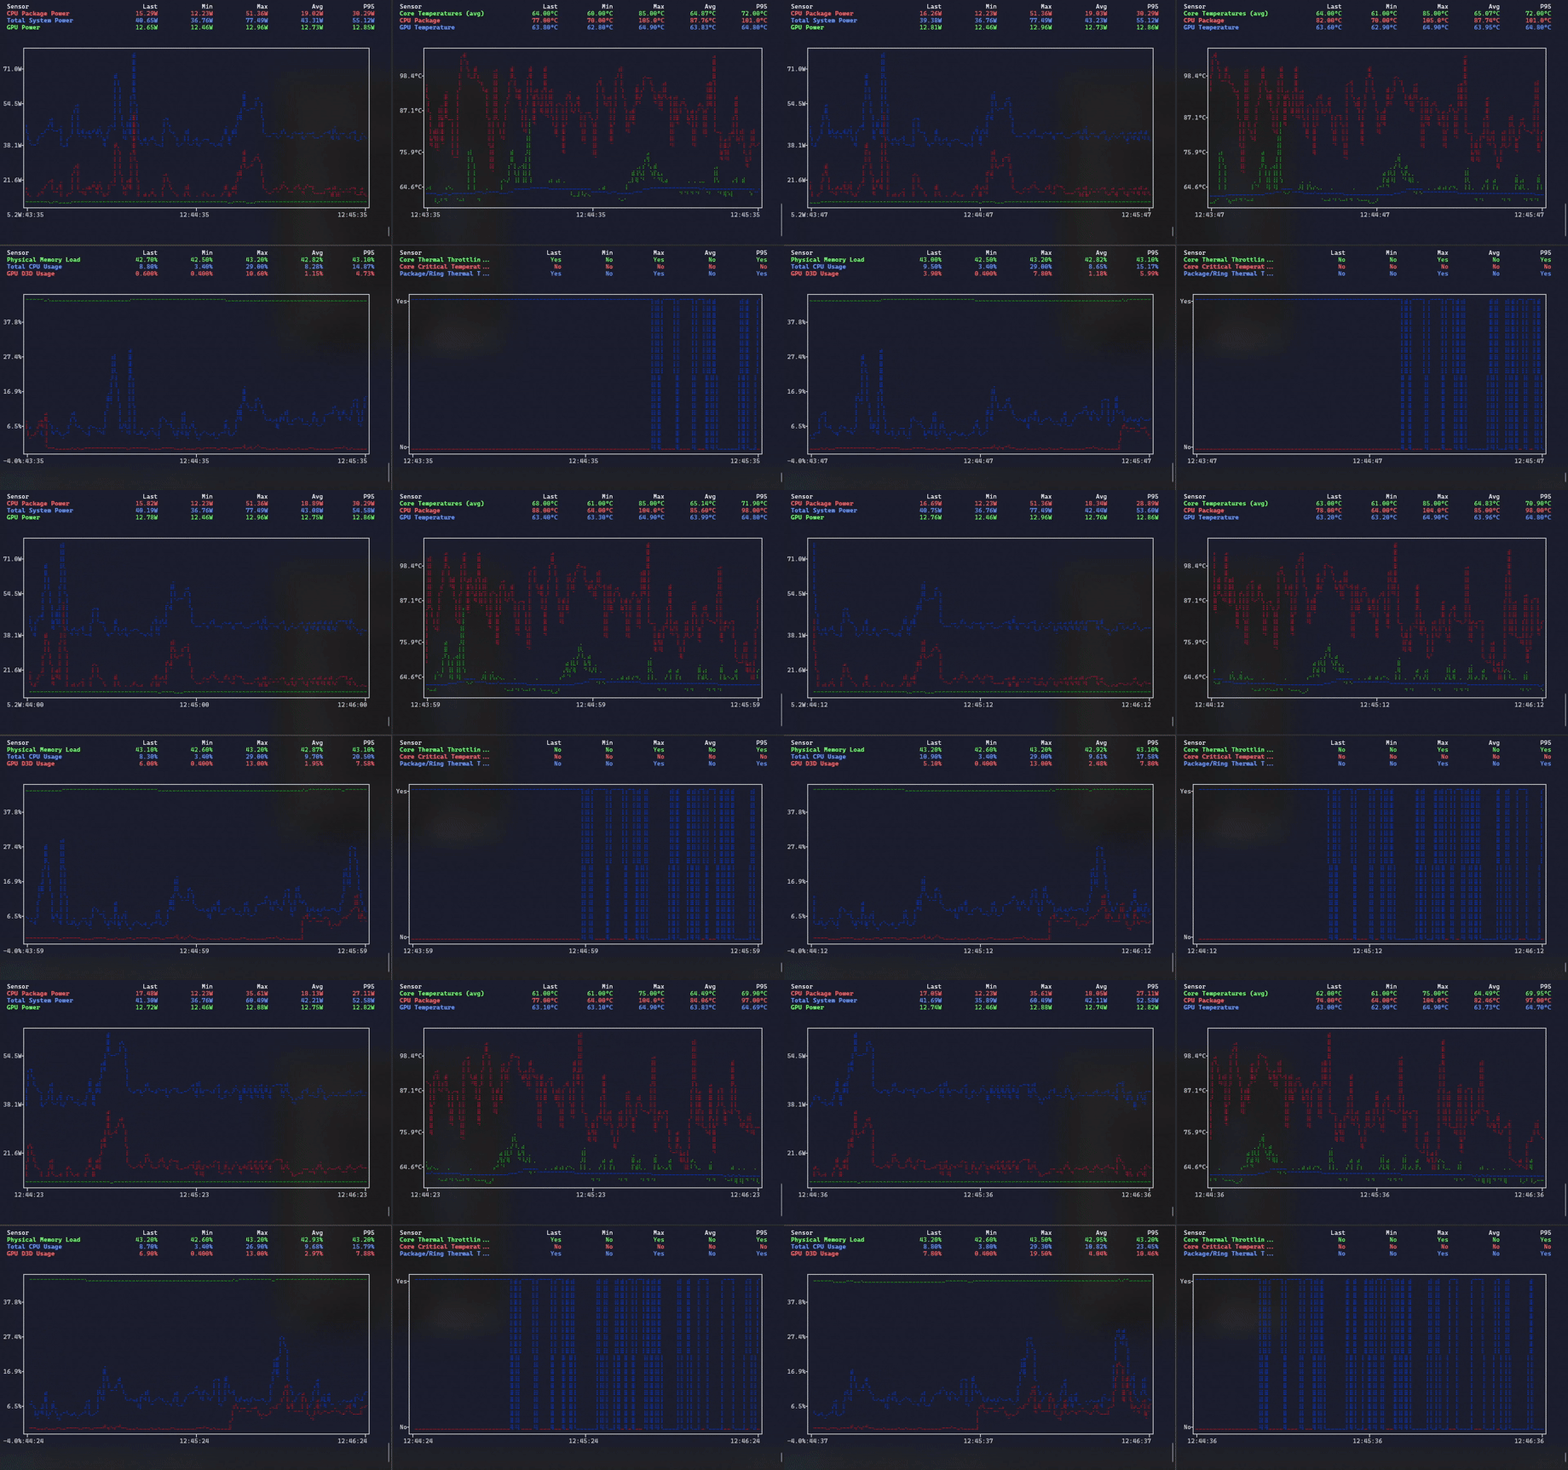
# top left pane
hwinfo-tui monitor sensors.CSV "CPU Package Power" "Total System Power" "GPU Power" --time-window 120 --refresh-rate 1

# bottom left pane
hwinfo-tui monitor sensors.CSV "Physical Memory Load" "Total CPU Usage" "GPU D3D Usage" --time-window 120 --refresh-rate 1

# top right pane
hwinfo-tui monitor sensors.CSV "Core Temperatures" "CPU Package" "GPU Temperature" --time-window 120 --refresh-rate 1

# bottom right pane
hwinfo-tui monitor sensors.CSV "Core Thermal Throttling" "Core Critical Temperature" "Package/Ring Thermal Throttling" --time-window 120 --refresh-rate 1
✨ Features
- Real-time Monitoring: Live sensor data visualization with configurable refresh rates
- gping-inspired UI: Clean interface with statistics table and interactive chart
- Unit-based Filtering: Automatically groups sensors by units, supports up to 2 units simultaneously
- Dual Y-axes: Charts can display different units on left and right axes
- Clean Interface: Focused visualization without unnecessary interactive distractions
- Responsive Design: Automatically adapts to terminal size with compact mode
- Fuzzy Sensor Matching: Partial sensor name matching with suggestions
- Rich Statistics: Min, max, average, and 95th percentile calculations
📦 Installation
Windows (Recommended)
winget install hwinfo-tui
Or download the portable executable - no installation required.
Cross-Platform
pip install hwinfo-tui
From Source
git clone https://github.com/hwinfo-tui/hwinfo-tui.git
cd hwinfo-tui

# Quick setup (recommended)
./setup.sh  # or setup.bat/setup.ps1 on Windows

# Manual setup
python -m venv venv
source venv/bin/activate  # or venv\Scripts\activate on Windows
pip install -e .
🚀 Quick Start
-
Configure HWInfo64 logging (Windows): Open HWiNFO → Sensors → Start Logging → Choose CSV format and location
-
Monitor sensors:
# Basic usage
hwinfo-tui monitor sensors.csv "CPU Package"

# Multiple sensors
hwinfo-tui monitor sensors.csv "Core Temperatures" "GPU Temperature" "CPU Package"

# Mixed units with custom settings
hwinfo-tui monitor sensors.csv "Total CPU Usage" "Core Temperatures" --refresh-rate 0.5 --time-window 600
💡 Usage Examples
# Single unit (temperature)
hwinfo-tui monitor sensors.csv "Core Temperatures" "GPU Temperature" "CPU Package"

# Single unit (percentage)
hwinfo-tui monitor sensors.csv "Total CPU Usage" "GPU Core Load" "GPU Memory Usage"

# Dual units (temperature + percentage)
hwinfo-tui monitor sensors.csv "Core Temperatures" "Total CPU Usage" "GPU Temperature"

# Dual units (power + temperature)
hwinfo-tui monitor sensors.csv "CPU Package Power" "CPU Package" "GPU Power"

# List available sensors
hwinfo-tui list-sensors sensors.csv
hwinfo-tui list-sensors sensors.csv --unit "°C" --limit 20
📋 Command Line Reference
Main Command
Usage: hwinfo-tui [OPTIONS] COMMAND [ARGS]...
A gping-inspired terminal visualization tool for monitoring real-time hardware sensor data from HWInfo.
Options:
--version- Show version information and exit--install-completion- Install completion for the current shell--show-completion- Show completion for the current shell--help- Show this message and exit
Commands:
monitor- Monitor hardware sensors in real-timelist-sensors- List all available sensors in the CSV file
monitor
Usage: hwinfo-tui monitor [OPTIONS] CSV_FILE SENSOR_NAMES...
Monitor hardware sensors in real-time.
Arguments:
CSV_FILE(required) - Path to HWInfo sensors.csv fileSENSOR_NAMES...(required) - One or more sensor names to monitor (supports partial matching)
Options:
-r, --refresh-rate FLOAT- Update frequency in seconds (0.1-60.0) [default: 1.0]-w, --time-window INTEGER- History window in seconds (10-7200) [default: 300]--help- Show this message and exit
list-sensors
Usage: hwinfo-tui list-sensors [OPTIONS] CSV_FILE
List all available sensors in the CSV file.
This command helps you discover sensor names for monitoring.
Arguments:
CSV_FILE(required) - Path to HWInfo sensors.csv file
Options:
-u, --unit TEXT- Filter sensors by unit (e.g., '°C', '%', 'W')-l, --limit INTEGER- Maximum number of sensors to display (1-1000) [default: 50]--help- Show this message and exit
⚙️ HWInfo64 Setup (Windows)
- Download and install HWInfo64 (Windows only)
- Open Sensors window → File → Start Logging
- Choose CSV format and location
- Set logging interval (1-2 seconds recommended)
- Use the generated CSV file with HWInfo TUI
🔧 Unit Filtering
HWInfo TUI automatically filters sensors based on their units:
- Single Unit: All sensors with the same unit (e.g., °C)
- Dual Units: Up to 2 different units on separate Y-axes
- Auto-exclusion: Incompatible sensors excluded with warnings
# Third unit [W] would be excluded and show a warning
hwinfo-tui monitor sensors.csv "Core Temperatures" "Total CPU Usage" "CPU Power"
💻 System Requirements
- Python: 3.8 or higher
- Terminal: Any modern terminal with color support
- Platform: Windows (HWInfo64 is Windows-only)
- Dependencies: typer, rich, plotext, pandas, watchdog
Note: While HWInfo TUI can run on any platform with Python, HWInfo64 is only available for Windows. On other platforms, you can use HWInfo TUI with CSV files generated on Windows.
🚀 Performance
- Memory Usage: < 50MB baseline, < 100MB with full data retention
- CPU Overhead: < 2% of single core during normal operation
- Startup Time: < 2 seconds from launch to first display
- Update Frequency: Configurable from 0.1 to 60 seconds
🛠️ Troubleshooting
No matching sensors found
hwinfo-tui list-sensors sensors.csv  # Check available sensors
hwinfo-tui monitor sensors.csv "CPU" "GPU"  # Use partial names
Too many units excluded
- Maximum 2 units supported - group sensors by similar units
File not found
- Ensure HWInfo is actively logging to the CSV file
- Verify file path and permissions
Poor performance
hwinfo-tui monitor sensors.csv "CPU" --refresh-rate 2.0 --time-window 120
Debug mode
HWINFO_TUI_LOG_LEVEL=DEBUG hwinfo-tui monitor sensors.csv "CPU"
🤝 Contributing
Contributions welcome! See CONTRIBUTING.md for guidelines.
Development Setup
# Clone and setup
git clone https://github.com/hwinfo-tui/hwinfo-tui.git
cd hwinfo-tui
./setup.sh  # or setup.bat on Windows

# Activate environment
source ./activate.sh  # or activate.bat/activate.ps1 on Windows

# Run tests
pytest

# Run the app
hwinfo-tui monitor sensors.csv "CPU"
📄 License
MIT License - see LICENSE file for details.
🙏 Acknowledgments
- Inspired by gping for the clean TUI design
- Built with Rich for beautiful terminal output
- Uses plotext for ASCII charts
- Powered by Typer for the CLI interface
📝 Changelog
See CHANGELOG.md for version history and updates.