Flame Graphs for Spark - Tools and Notes
May 16, 2025 · View on GitHub
In this note you can find a few links and basic examples relevant to using FlameGraphs for profiling Apache Spark workloads running in the JVM on Linux. This covers profiling the JVM and profiling Python (notably for Python UDFs in Spark).
Note on Spark 4.x
Spark 4.0 comes with a new feature for the Web UI that allows you to visualize the Flame Graphs directly in the Spark UI.
This is a great addition, as it simplifies the process of analyzing performance issues and provides a more integrated experience for users.
It is managed cia a parameter in the Spark configuration: spark.ui.threadDump.flamegraphEnabled=true (by default it is set to true).
TL;DR use async-profiler for profiling JVM and py-spy for Python
See also
- Spark and Pyroscope
- the blog post Enhancing Apache Spark Performance with Flame Graphs: A Practical Example Using Grafana Pyroscope
Flamegraphs for JVM: Java, Scala (Spark)
Link to async-profiler on GitHub. Build async profiler as in the README:
- downloaded the latest version
- or build from source with
make(need toexport JAVA_HOME=..to a valid JDK first)
Example of how to use async-profiler for Spark
-
A simple test is with Spark in local mode, as in this configuration driver and executors are all in one JVM on your local machine (
bin/spark-shell --master local[*])- First find the pid of the JVM running Spark driver and executor, for example run:
$ jps
171657 SparkSubmit
- First find the pid of the JVM running Spark driver and executor, for example run:
-
For Spark on clusters, this is more complex
-
identify one executor to trace (use the Spark WebUI to find the address of the running executors)
-
connect (via shell) to the executor: for example to a YARN node or k8s container
-
you need to be able to run async-profiler on the shell
-
Profile JVM and create the FlameGraph:
# profile by time (regardless if process is on CPU or waiting)
# with older versions of async profiler use .svg files rather than .html
./profiler.sh -e wall -d 30 -f $PWD/flamegraph1.html <pid_of_JVM>

# profile on-CPU threads, without using perf
./profiler.sh -e itimer -d 30 -f $PWD/flamegraph1.html <pid_of_JVM>
- Visualize the JVM execution FlameGraph:
firefox flamegraph1.svg
- Drill down to the part of the FlameGraph of interest (click on svg to zoom in), for example:
zoom in to
java/util/concurrent/ThreadPoolExecutor$Worker.run+ further zoom in toorg/apache/spark/executor/Executor$TaskRunner.run
If you want to use CPU profiling (or profiling other per events) using perf (mode -e cpu you need also
to set the following and run profiling as root:
# echo 1 > /proc/sys/kernel/perf_event_paranoid
# echo 0 > /proc/sys/kernel/kptr_restrict
FlameGraph repo:
Download: git clone https://github.com/brendangregg/FlameGraph
Example of usage of async-profiler
Download from [https://github.com/jvm-profiling-tools/async-profiler]
Build as in the README (export JAVA_HOME and make)
Find the pid of the JVM runnign the Spark executor, example:
$ jps
171657 SparkSubmit
171870 Jps
Profile JVM and create the flamegraph, example:
./profiler.sh -d 30 -f $PWD/flamegraph1.html <pid_of_JVM>
Visualize the on-CPU flamegraph:
firefox flamegraph1.html
Example of the output:
Click here to get the SVG version of the on-CPU Flamegraph
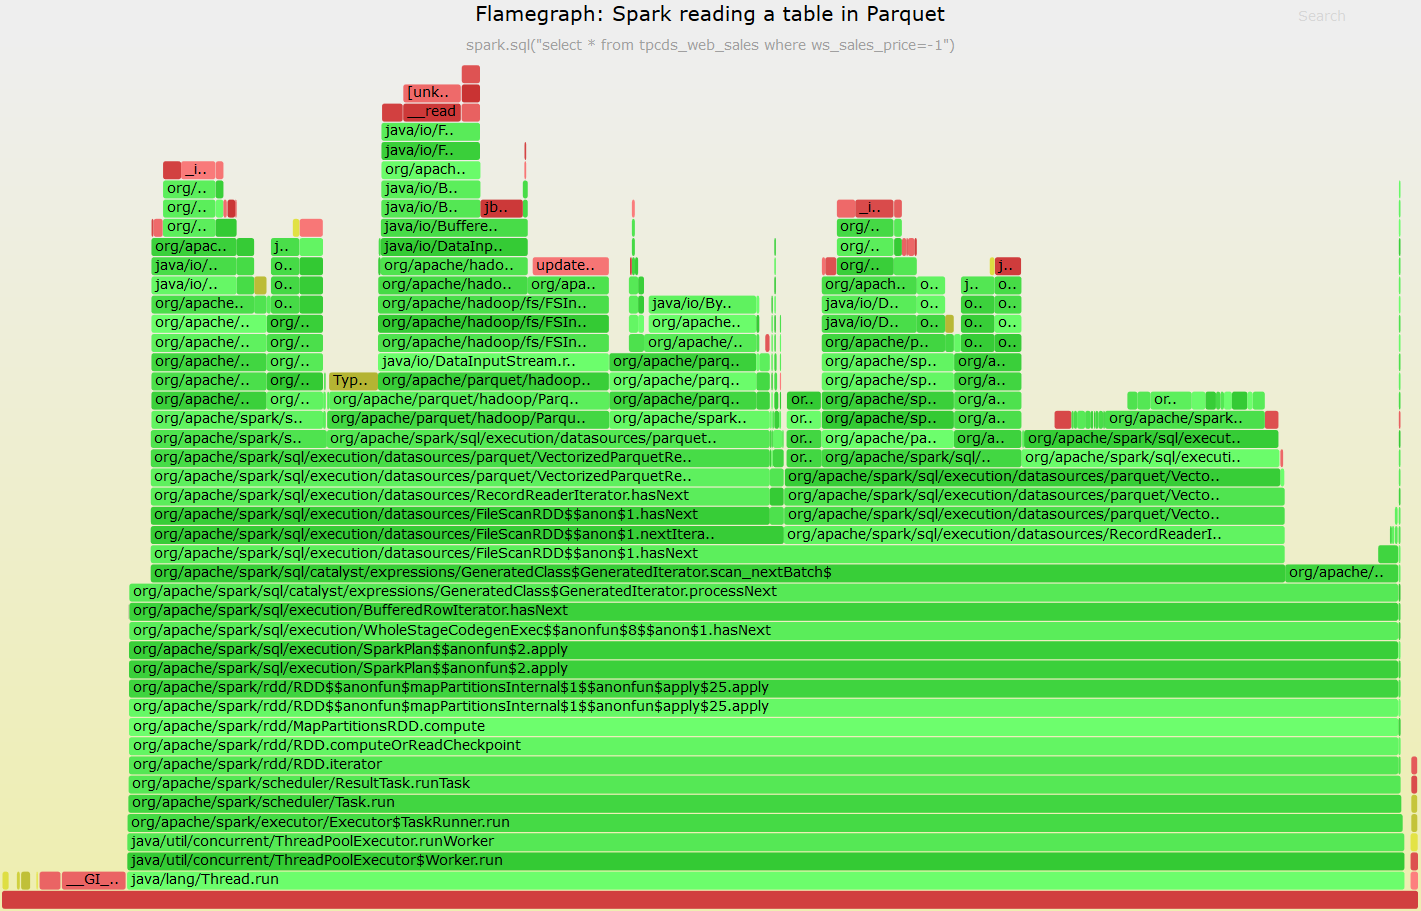
async-profiler by default records stack traces on CPU events, it can also be configured to record stack traces on other type of events. The list of available events is available as in this example:
./profiler.sh list <pid_of_JVM>

Basic events:
  cpu
  alloc
  lock
  wall
  itimer
Perf events:
  page-faults
  context-switches
  cycles
  instructions
  cache-references
  cache-misses
  branches
  branch-misses
  bus-cycles
  L1-dcache-load-misses
  LLC-load-misses
  dTLB-load-misses
  mem:breakpoint
  trace:tracepoint
Example of profile on alloc (heap memory allocation) events
./profiler.sh -d 30  -e alloc -f $PWD/flamegraph_heap.svg <pid_of_JVM>
../FlameGraph/flamegraph.pl --colors=mem flamegraph_heap.txt >flamegraph_heap.svg
Example output:
Click here to get the SVG version of the Heap Flamegraph
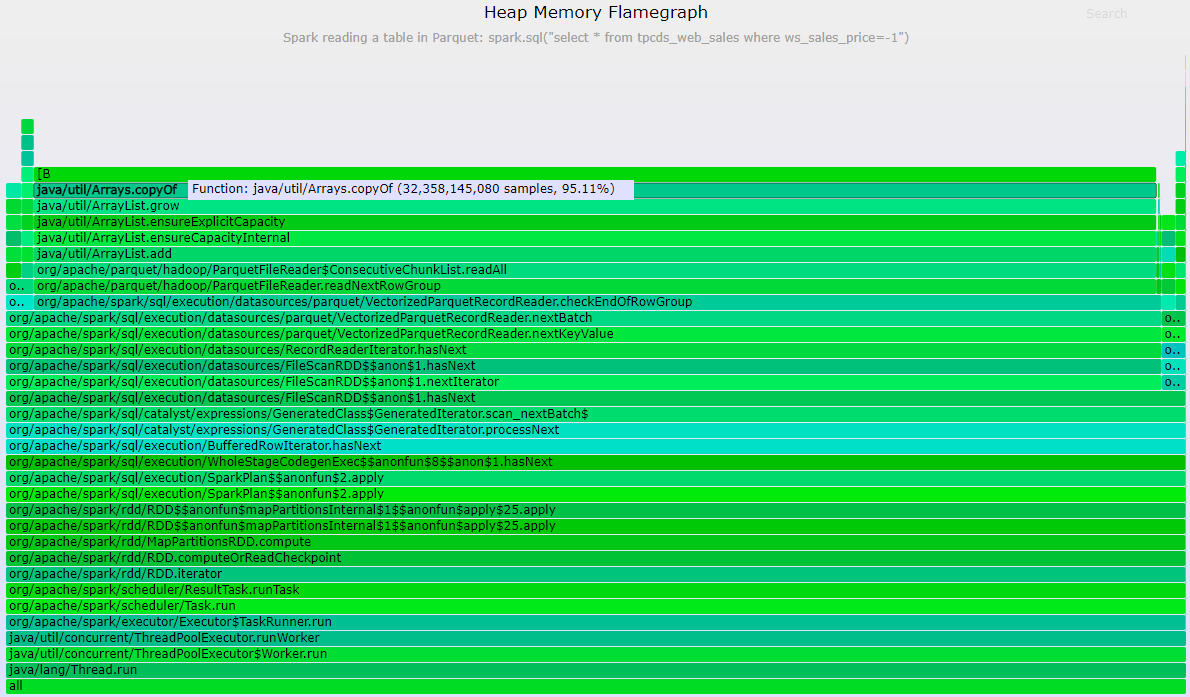
Python
Profile Python code with flame graph for Spark when using PySpark and Python UDF, for example.
A good tool to use (for test environments) is py-spy:
Install and example:
pip install py-spy
py-spy record -d 30 -p <pid> --nonblocking -o myFlamegraph.svg
Ideas on how to profile Python UDF: attach the profiler to the pyspark.daemon coordinator with -s option
to profile also the subprocesses spawned by it (the pyspark.daemon workers).
Note: I found at least one case where --nonblocking was needed, see also this
FlameGraph and async JVM stack profiling for Spark on YARN
Profile one executor, example:
- First, find the executor hostname and pid, for example use Spark WebUI or run
sc.getExecutorMemoryStatus - With
psorjps -vfind pid of the executor process, on YARN Spark 3.0 uses the classYarnCoarseGrainedExecutorBackend, on Spark 2.4 is insteadCoarseGrainedExecutorBackend - Profile the executor pid as detailed above
FlameGraph and Async JVM stack profiling for Spark on Kubernetes
How to profile one executor, example:
- Identify a Kubernetes pod to profile
kubectl get pods [-n namespace] - copy async profiler from driver to executor:
kubectl cp async-profiler-1.6 <pod_name_here>:/opt/spark/work-dir - run profiler as described above, in
-e wallor-e itimermode - using async profiler with perf in
-e cpumode, is also possible, ideally running from host system/VM, details here
Context
Stack profiling and on-CPU Flame Graph visualization are very useful tools and techniques for investigating CPU workloads.
See Brendan Gregg's page on Flame Graphs
Stack profiling is useful for understanding and drilling-down on "hot code":
you can use it to find parts of the code using considerable amount of time and provide insights for troubleshooting.
FlameGraph visualization of the stack profiles brings additional value, including the fact of
being an appealing interface and providing context about the running the code, by showing for example the parent functions.
The main challenge that several tools undertake for profiling the JVM is on how to collect stack frames precisely and with low overhead. For more details related to the challenges of profiling Java/JVM see
- Nitsan Wakart: Using FlameGraphs To Illuminate The JVM by, Exploring Java Perf Flamegraphs
- Brendan Gregg: Java in Flames
A list of profilers relevant for troubleshooting Spark workloads
- async-profiler (see also an example of usage later in this note)
- based on AsyncGetCallTrace, also has perf events
- no need to install agents
- info from the tool's author: Andrei Pangin: Everything you wanted to know about Stack Traces and Heap Dumps
- more info at [http://psy-lob-saw.blogspot.ch/2017/02/flamegraphs-intro-fire-for-everyone.html]
- see also this [http://blogs.microsoft.co.il/sasha/2017/07/07/profiling-the-jvm-on-linux-a-hybrid-approach/]
- issues with sampling at safepoint: [http://psy-lob-saw.blogspot.ch/2016/02/why-most-sampling-java-profilers-are.html]
- honest-profiler
- also based on AsyncGetCallTrace, deploy an agent on the JVM, which allows also remote control
- methods based on Java Flight Recorder
- See [https://gist.github.com/kayousterhout/7008a8ebf2babeedc7ce6f8723fd1bf4]
- an example at Apache Spark 2.0 Performance Improvements Investigated With Flame Graphs:
- only measures the JVM
- needs also [https://github.com/lhotari/jfr-report-tool]
- JFR requires license from Oracle if used in production up to Java version 1.8, for Java 9 and higher I understand with is now in open source
- Perf
- see Brendan's pages and the blog post Java in Flames
- goes together with perf-map-agent
- See also Profiling JVM applications
- perf is a great tool, but not my favourite method for Spark profiling, as many functions appear listed as "interpreter" and cannot be resolved by this method.
- see also the additional JVM options when running Spark (see examples below)
- method with the statsd-jvm-profiler
- see Spark in Flames
- note, I have not yet tested this
- Methods based on jstack
- run jstack on the executors at low frequency for profiling has high overhead. Typically you would do this manually to get an idea of a stuck process. Similarly one can dump executors stack traces "manually" from the WebUI
- I understood that Facebook used a jstack-sampling method for their flamegraph, as reported at the Spark Summit Europe 2016 talk Apache Spark at Scale: A 60 TB+ Production Use Case by Sital Kedia Reported to hav
- Many commercial tools exist that provide profiling
- the talk [Using FlameGraphs To Illuminate The JVM by Nitsan Wakart](Using FlameGraphs To Illuminate The JVM by Nitsan Wakart) lists some of the tools
- most commercial profiling tool report prole data as trees
- most commercial profiling tools use SafePoints rather than AsyncGetCallTrace
- Distributed Hadoop Profiler HProfiler
- based on perf, integrates with YARN and aggregates profiles
- Python: py-spy
Example of usage of perf for java/Spark:
Get perf-map-agent and build it following instructions at:
https://github.com/jvm-profiling-tools/perf-map-agent
set JAVA_HOME and AGENT_OME for FlameGraph/jmaps
run Spark with extra java options. examples:
--conf "spark.driver.extraJavaOptions"="-XX:+PreserveFramePointer"
or:
--conf "spark.driver.extraJavaOptions"="-XX:+PreserveFramePointer -XX:+UnlockDiagnosticVMOptions -XX:+DebugNonSafepoints"
note:
similarly add options on executors with --conf "spark.driver.extraJavaOptions"=...
Gather data with (example):
perf record -a -g -F 99 -p <pid> sleep 10; FlameGraph/jmaps
Generate the flamegraph:
perf script |../FlameGraph/stackcollapse-perf.pl | ../FlameGraph/flamegraph.pl > perfFlamegraph1.svg
Example of usage of JMC and Java Flight Recorder
Start Spark with the extra Java options (only driver options needed if running in local mode):
--conf "spark.driver.extraJavaOptions"="-XX:+UnlockCommercialFeatures -XX:+FlightRecorder -XX:+UnlockDiagnosticVMOptions -XX:+DebugNonSafepoints -XX:FlightRecorderOptions=stackdepth=1024"
--conf "spark.executor.extraJavaOptions"="-XX:+UnlockCommercialFeatures -XX:+FlightRecorder -XX:+UnlockDiagnosticVMOptions -XX:+DebugNonSafepoints -XX:FlightRecorderOptions=stackdepth=1024"
Gather data:
jcmd 146903 JFR.start filename=sparkProfile1.jfr duration=30s
Process the Java Flight Recorder file with jfr-report-tool, see instructions at: [https://github.com/lhotari/jfr-report-tool]
jfr-report-tool/jfr-report-tool -e none -m 1 sparkProfile3.jfr
In alternative can use:
[https://github.com/chrishantha/jfr-flame-graph]
jfr-flame-graph/run.sh -f sparkProfile1.jfr -o spark_jfr_out.txt
../FlameGraph/flamegraph.pl spark_jfr_out.txt > perf2.svg