tsfeatures
September 1, 2021 · View on GitHub




tsfeatures
Calculates various features from time series data. Python implementation of the R package tsfeatures.
Installation
You can install the released version of tsfeatures from the Python package index with:
pip install tsfeatures
Usage
The tsfeatures main function calculates by default the features used by Montero-Manso, Talagala, Hyndman and Athanasopoulos in their implementation of the FFORMA model.
from tsfeatures import tsfeatures
This function receives a panel pandas df with columns unique_id, ds, y and optionally the frequency of the data.
<img src=https://raw.githubusercontent.com/FedericoGarza/tsfeatures/master/.github/images/y_train.png width="152">
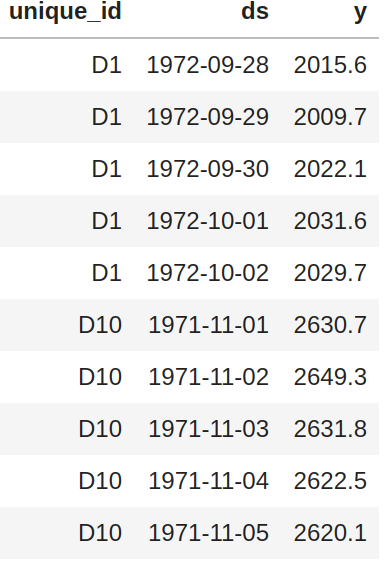
tsfeatures(panel, freq=7)
By default (freq=None) the function will try to infer the frequency of each time series (using infer_freq from pandas on the ds column) and assign a seasonal period according to the built-in dictionary FREQS:
FREQS = {'H': 24, 'D': 1,
         'M': 12, 'Q': 4,
         'W':1, 'Y': 1}
You can use your own dictionary using the dict_freqs argument:
tsfeatures(panel, dict_freqs={'D': 7, 'W': 52})
List of available features
| Features | ||
|---|---|---|
| acf_features | heterogeneity | series_length |
| arch_stat | holt_parameters | sparsity |
| count_entropy | hurst | stability |
| crossing_points | hw_parameters | stl_features |
| entropy | intervals | unitroot_kpss |
| flat_spots | lumpiness | unitroot_pp |
| frequency | nonlinearity | |
| guerrero | pacf_features |
See the docs for a description of the features. To use a particular feature included in the package you need to import it:
from tsfeatures import acf_features

tsfeatures(panel, freq=7, features=[acf_features])
You can also define your own function and use it together with the included features:
def number_zeros(x, freq):

    number = (x == 0).sum()
    return {'number_zeros': number}

tsfeatures(panel, freq=7, features=[acf_features, number_zeros])
tsfeatures can handle functions that receives a numpy array x and a frequency freq (this parameter is needed even if you don't use it) and returns a dictionary with the feature name as a key and its value.
R implementation
You can use this package to call tsfeatures from R inside python (you need to have installed R, the packages forecast and tsfeatures; also the python package rpy2):
from tsfeatures.tsfeatures_r import tsfeatures_r

tsfeatures_r(panel, freq=7, features=["acf_features"])
Observe that this function receives a list of strings instead of a list of functions.
Comparison with the R implementation (sum of absolute differences)
Non-seasonal data (100 Daily M4 time series)
| feature | diff | feature | diff | feature | diff | feature | diff |
|---|---|---|---|---|---|---|---|
| e_acf10 | 0 | e_acf1 | 0 | diff2_acf1 | 0 | alpha | 3.2 |
| seasonal_period | 0 | spike | 0 | diff1_acf10 | 0 | arch_acf | 3.3 |
| nperiods | 0 | curvature | 0 | x_acf1 | 0 | beta | 4.04 |
| linearity | 0 | crossing_points | 0 | nonlinearity | 0 | garch_r2 | 4.74 |
| hw_gamma | 0 | lumpiness | 0 | diff2x_pacf5 | 0 | hurst | 5.45 |
| hw_beta | 0 | diff1x_pacf5 | 0 | unitroot_kpss | 0 | garch_acf | 5.53 |
| hw_alpha | 0 | diff1_acf10 | 0 | x_pacf5 | 0 | entropy | 11.65 |
| trend | 0 | arch_lm | 0 | x_acf10 | 0 | ||
| flat_spots | 0 | diff1_acf1 | 0 | unitroot_pp | 0 | ||
| series_length | 0 | stability | 0 | arch_r2 | 1.37 |
To replicate this results use:
python -m tsfeatures.compare_with_r --results_directory /some/path
                                    --dataset_name Daily --num_obs 100
Sesonal data (100 Hourly M4 time series)
| feature | diff | feature | diff | feature | diff | feature | diff |
|---|---|---|---|---|---|---|---|
| series_length | 0 | seas_acf1 | 0 | trend | 2.28 | hurst | 26.02 |
| flat_spots | 0 | x_acf1 | 0 | arch_r2 | 2.29 | hw_beta | 32.39 |
| nperiods | 0 | unitroot_kpss | 0 | alpha | 2.52 | trough | 35 |
| crossing_points | 0 | nonlinearity | 0 | beta | 3.67 | peak | 69 |
| seasonal_period | 0 | diff1_acf10 | 0 | linearity | 3.97 | ||
| lumpiness | 0 | x_acf10 | 0 | curvature | 4.8 | ||
| stability | 0 | seas_pacf | 0 | e_acf10 | 7.05 | ||
| arch_lm | 0 | unitroot_pp | 0 | garch_r2 | 7.32 | ||
| diff2_acf1 | 0 | spike | 0 | hw_gamma | 7.32 | ||
| diff2_acf10 | 0 | seasonal_strength | 0.79 | hw_alpha | 7.47 | ||
| diff1_acf1 | 0 | e_acf1 | 1.67 | garch_acf | 7.53 | ||
| diff2x_pacf5 | 0 | arch_acf | 2.18 | entropy | 9.45 |
To replicate this results use:
python -m tsfeatures.compare_with_r --results_directory /some/path \
                                    --dataset_name Hourly --num_obs 100
Authors
- Federico Garza - FedericoGarza
- Kin Gutierrez - kdgutier
- Cristian Challu - cristianchallu
- Jose Moralez - jose-moralez
- Ricardo Olivares - rolivaresar
- Max Mergenthaler - mergenthaler