Radar Charts
September 6, 2020 · View on GitHub
Content
Overview
-
soccerplots,radar_chartmodule helps you plot radar charts in a few lines of code. -
The radar-chart theme is inspired from Statsbomb.
-
Here we will look at the documentation and some examples on how to use
soccerplotto plot radar charts.
soccerplots.radar_chart.Radar
soccerplots.radar_chart.Radar(
    background_color="#FFFFFF", patch_color="#D6D6D6", fontfamily="Liberation Serif",
    label_fontsize=10, range_fontsize=6.5, label_color="#000000", range_color="#000000"
)
| No. | Parameter | About Parameter |
|---|---|---|
| 1. | background_color | (str, optional) the background color of the plot. Defaults to "#FFFFFF". |
| 2. | patch_color | (str, optional) the color for our circle. Defaults to "#D6D6D6". |
| 3. | fontfamily | (str, optional) fontfamily available in matplotlib. Defaults to "Liberation Serif". |
| 4. | label_fontsize | (float, optional) the fontsize of label. Defaults to 10. |
| 5. | range_fontsize | (float, optional) the fontsize for range values. Defaults to 6.5. |
| 6. | label_color | (str, optional) color value for labels. Defaults to "#000000". |
| 7. | range_color | (str, optional): color value for ranges. Defaults to "#000000". |
soccerplots.radar_chart.Radar.plot_radar
soccerplots.radar_chart.Radar.plot_radar(
     ranges, params, values, radar_color, filename=None, dpi=300,
     title=dict(), alphas=[0.6, 0.6], compare=False, endnote=None,
     end_size=9, end_color="#95919B", image=None, image_coord=None, figax=None, **kwargs
)
| No. | Parameter | About Parameter |
|---|---|---|
| 1. | ranges | (list) list of tuples containing min and max value for each parameter. |
| 2. | params | (list) list of string values containing the name of parameters. |
| 3. | values | (list) list of float values for each parameters/ nested list when making comparison charts. |
| 4. | radar_color | (list) list of two color values. |
| 5. | filename | (str, optional) the name per which the file will be saved added extension. Defaults to None. |
| 6. | dpi | (int, optional) dots per inch value. Defaults to 300. |
| 7. | title | (str, optional) containing information of title and subtitle. Defaults to dict(). |
| 8. | alphas | (list, optional) alpha value for color. Defaults to [0.6, 0.6]. |
| 9. | compare | (bool, optional) True, if comparison charts are to be made. Defaults to False. |
| 10. | endnote | (str, optional) the endnote of the plot. Defaults to None. |
| 11. | end_size | (int, optional) the font-size for the endnote string. Defaults to 9. |
| 12. | end_color | (str, optional) color of the endnote. Defaults to "#95919B". |
| 13. | image | (str, optional) image name to be added. Defaults to None. |
| 14. | image_coord | (list, optional) containing left, bottom, width, height for image. Defaults to None. |
| 15. | figax | (tuple, optional) figure and axis object. Defaults to None. |
| 16. | **kwargs | All other keyword arguments are passed on to matplotlib.axes.Axes.imshow. |
| No. | Returns | About |
|---|---|---|
| 1. | fig | (matplotlib.figure.Figure) figure object |
| 2. | ax | (axes.Axes) axis object |
Examples
-
Here we will look into some of the examples that can help in making radar-charts using
soccerplots. -
Examples Content:
- Making a simple Radar Chart
- Label And Range Fontsize
- Adding Title
- Adding title on both sides
- Adding Endnote
- Changing the size of endnote
- Changing color of endnote
- Saving radar chart
- Changing dpi
- Changing Font
- Adding Image
- Making comparison radar chart
- Changing alpha values for comparison radar
- Passing fig, ax
Making a simple Radar Chart
-
Here we will make a very simple radar chart using
soccerplotsmoduleradar_chart. -
We will be making use of
ranges,params,valuesandradar_colorparameter. -
Code Snippet:
from soccerplots.radar_chart import Radar

## parameter names
params = ['xAssist', 'Key Passes', 'Crosses Into Box', 'Cross Completion %', 'Deep Completions',
          'Progressive Passes', 'Prog. Pass Accuracy', 'Dribbles', 'Progressive Runs',
          'PADJ Interceptions', 'Succ. Def. Actions', 'Def Duel Win %']

## range values
ranges = [(0.0, 0.15), (0.0, 0.67), (0.06, 6.3), (19.51, 50.0), (0.35, 1.61),
          (6.45, 11.94), (62.9, 79.4), (0.43, 4.08), (0.6, 2.33),
          (4.74, 7.2), (8.59, 12.48), (50.66, 66.67)]

## parameter value
values = [0.11, 0.53, 0.70, 27.66, 1.05, 6.84, 84.62, 4.56, 2.22, 5.93, 8.88, 64.29]

## instantiate object
radar = Radar()

## plot radar
fig, ax = radar.plot_radar(ranges=ranges, params=params, values=values,
                                 radar_color=['#B6282F', '#FFFFFF'])
- Output:

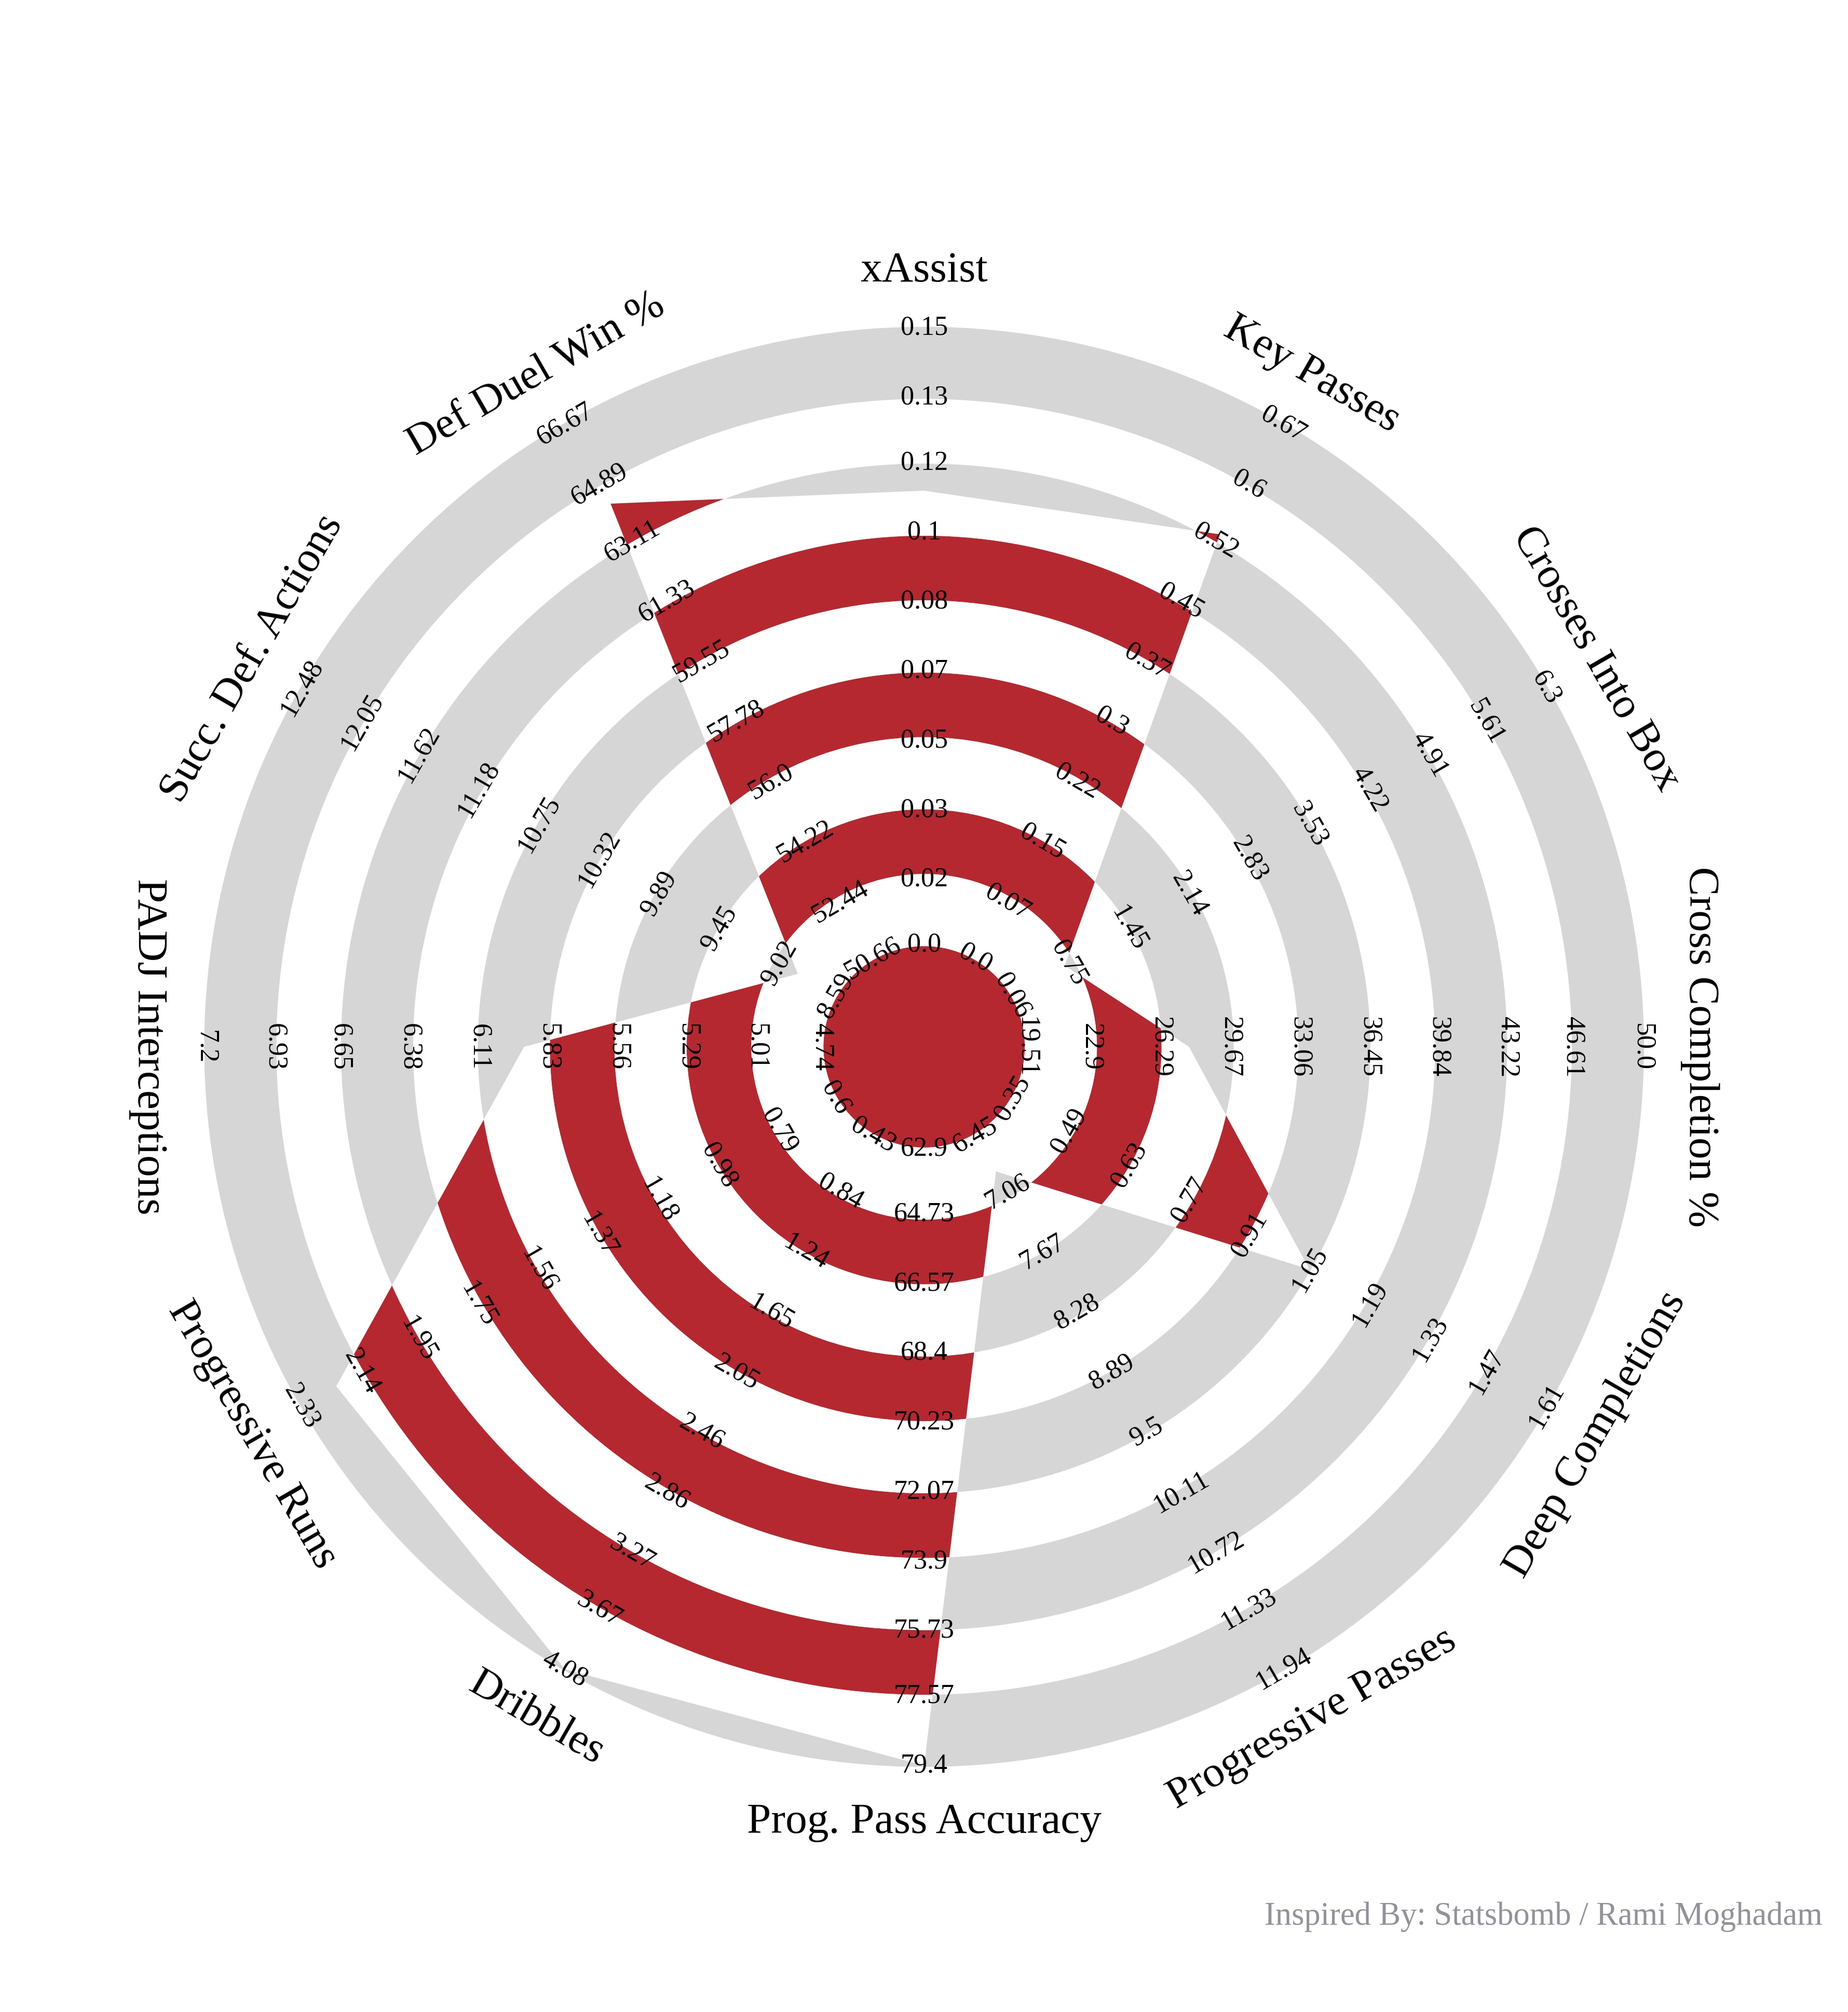
Label And Range Fontsize
-
Here we will see how we can use
label_fontsizeandrange_fontsizeparameter. We will here increase the values of these two parameters and you will see that the ranges and labels now are larger than the previous output. -
Code Snippet:
from soccerplots.radar_chart import Radar

## parameter names
params = ['xAssist', 'Key Passes', 'Crosses Into Box', 'Cross Completion %', 'Deep Completions',
          'Progressive Passes', 'Prog. Pass Accuracy', 'Dribbles', 'Progressive Runs',
          'PADJ Interceptions', 'Succ. Def. Actions', 'Def Duel Win %']

## range values
ranges = [(0.0, 0.15), (0.0, 0.67), (0.06, 6.3), (19.51, 50.0), (0.35, 1.61),
          (6.45, 11.94), (62.9, 79.4), (0.43, 4.08), (0.6, 2.33),
          (4.74, 7.2), (8.59, 12.48), (50.66, 66.67)]

## parameter value
values = [0.11, 0.53, 0.70, 27.66, 1.05, 6.84, 84.62, 4.56, 2.22, 5.93, 8.88, 64.29]

## instantiate object -- changing fontsize
radar = Radar(label_fontsize=12, range_fontsize=7.5)    ## change in parameter value

## plot radar
fig, ax = radar.plot_radar(ranges=ranges, params=params, values=values,
                           radar_color=['#B6282F', '#FFFFFF'])
- Output:
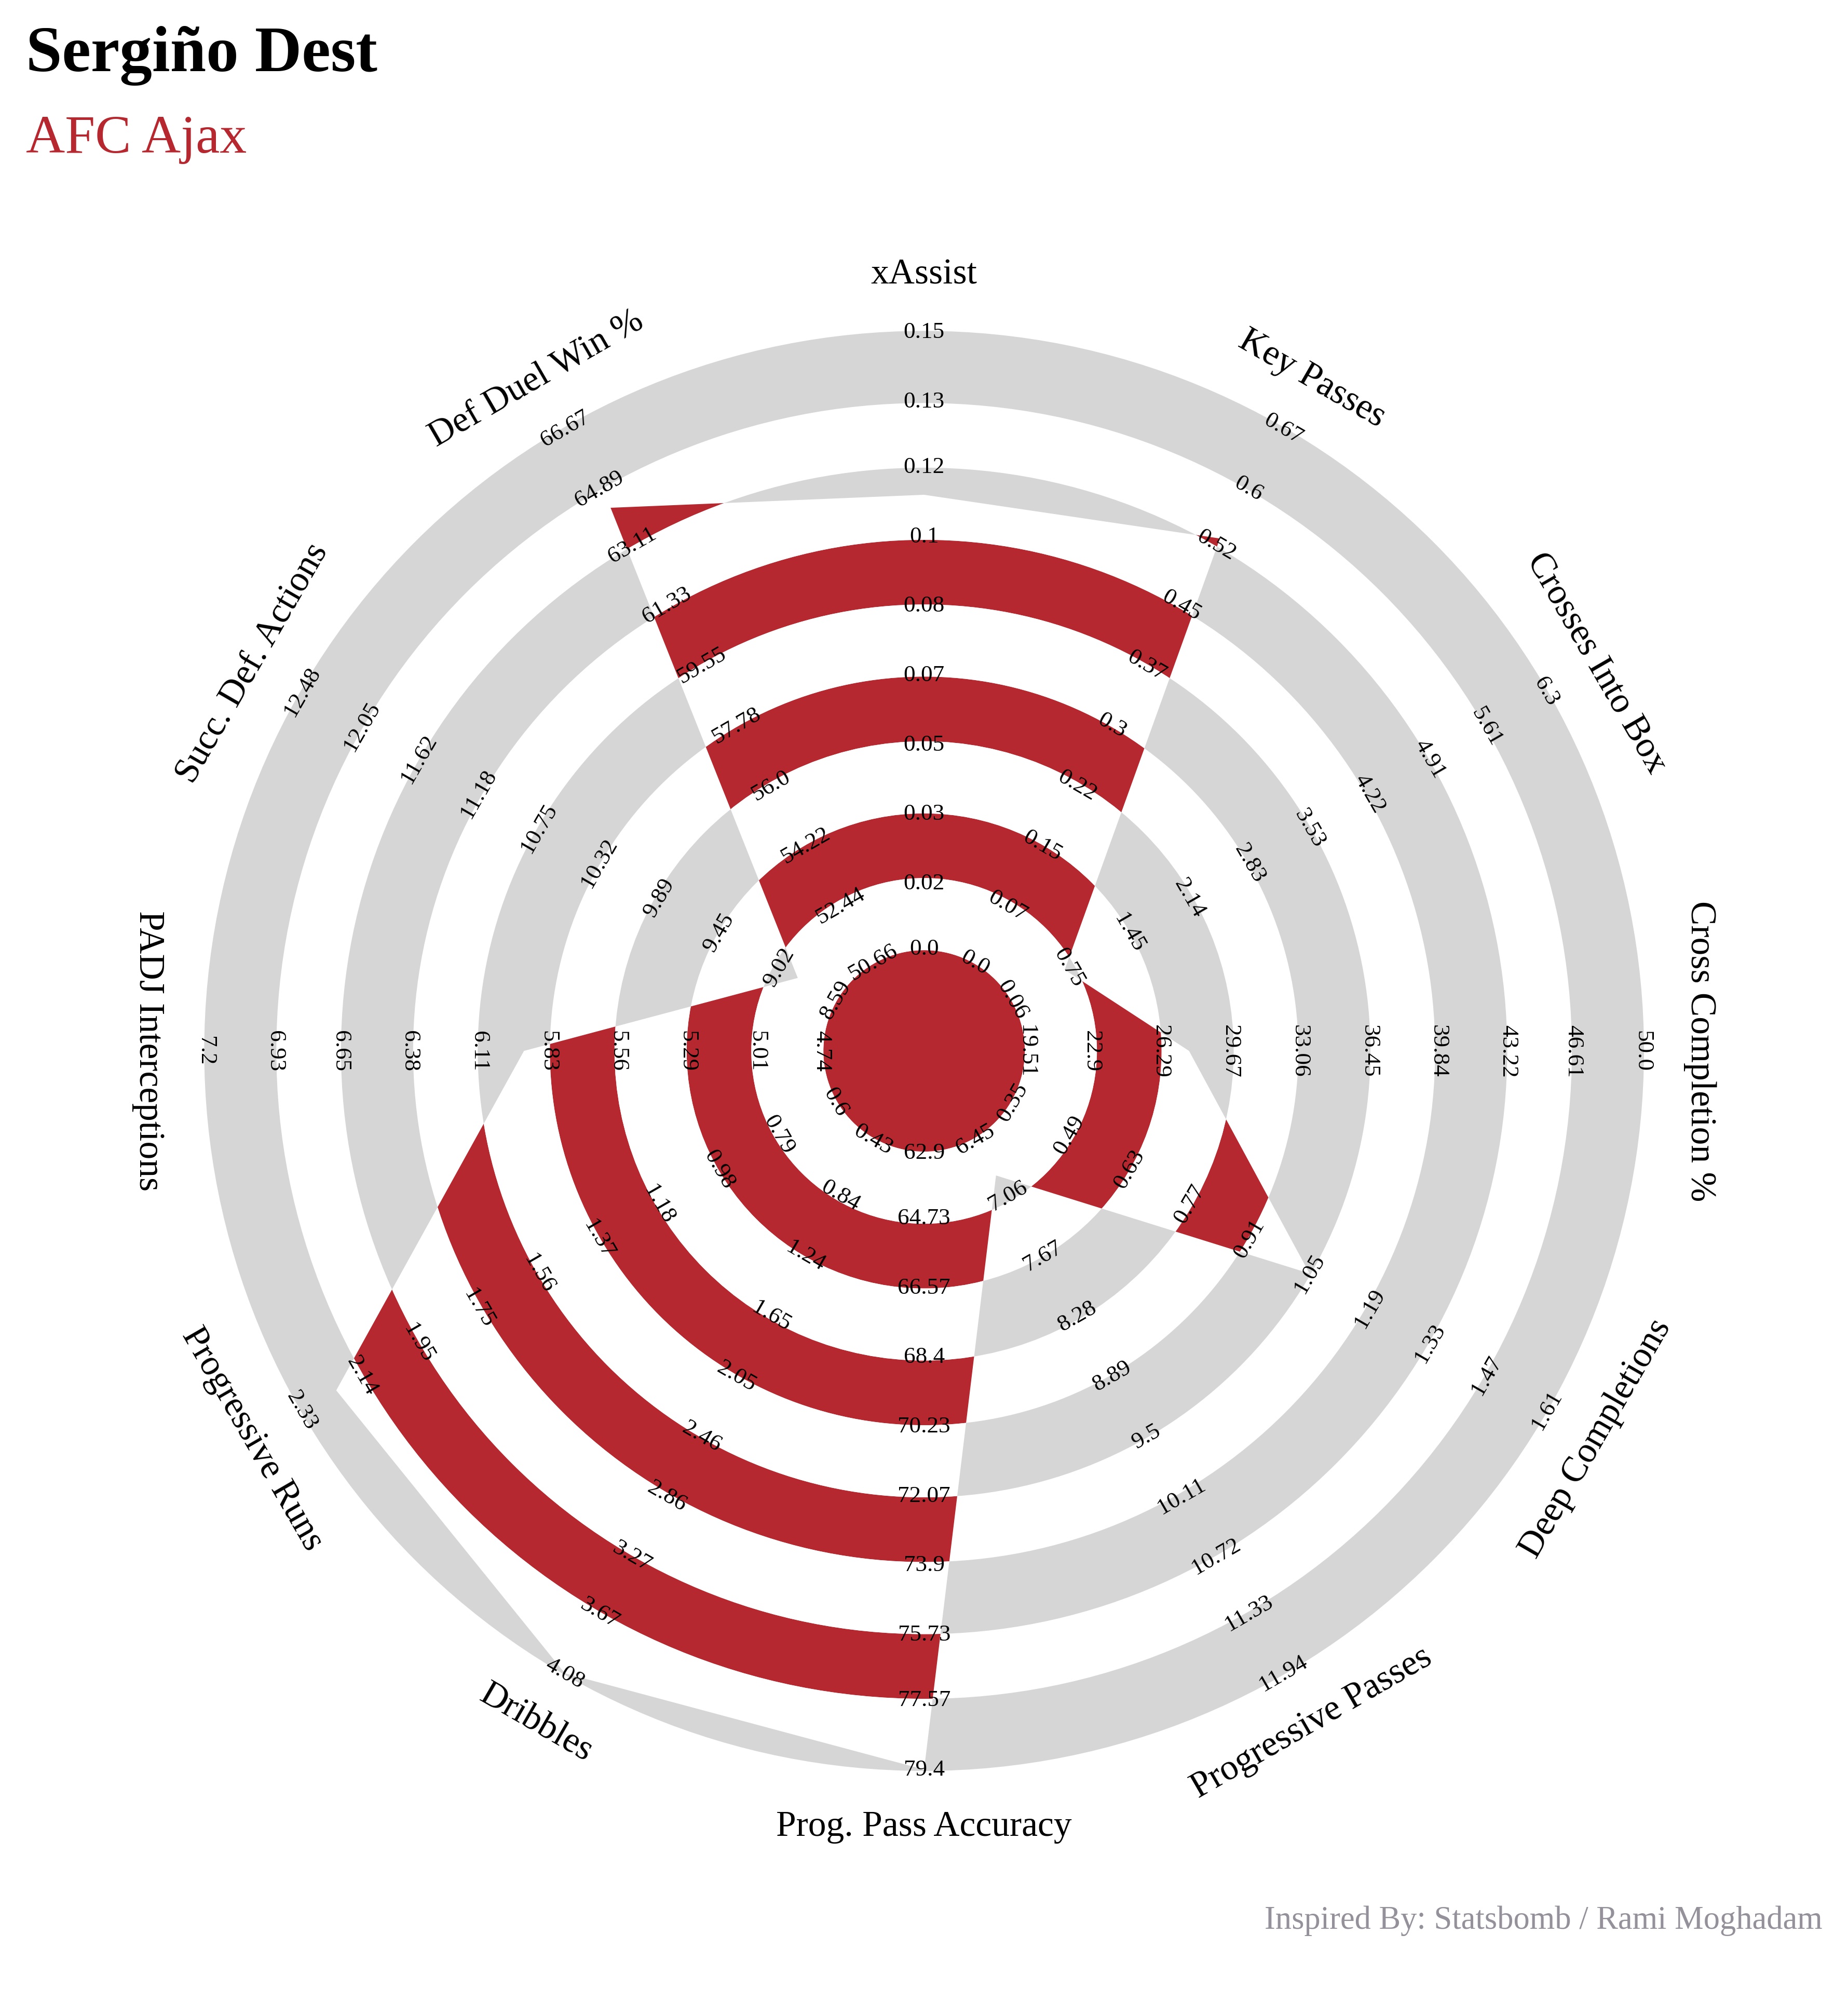
Adding Title
-
Here we will create a dictionary to specify title values and will pass it to
plot_radarmethod. -
Code Snippet:
from soccerplots.radar_chart import Radar

## parameter names
params = ['xAssist', 'Key Passes', 'Crosses Into Box', 'Cross Completion %', 'Deep Completions',
          'Progressive Passes', 'Prog. Pass Accuracy', 'Dribbles', 'Progressive Runs',
          'PADJ Interceptions', 'Succ. Def. Actions', 'Def Duel Win %']

## range values
ranges = [(0.0, 0.15), (0.0, 0.67), (0.06, 6.3), (19.51, 50.0), (0.35, 1.61),
          (6.45, 11.94), (62.9, 79.4), (0.43, 4.08), (0.6, 2.33),
          (4.74, 7.2), (8.59, 12.48), (50.66, 66.67)]

## parameter value
values = [0.11, 0.53, 0.70, 27.66, 1.05, 6.84, 84.62, 4.56, 2.22, 5.93, 8.88, 64.29]

## title values
title = dict(
    title_name='Sergiño Dest',
    title_color='#000000',
    subtitle_name='AFC Ajax',
    subtitle_color='#B6282F',
    title_fontsize=18,
    subtitle_fontsize=15,
)

## instantiate object
radar = Radar()

## plot radar -- title
fig, ax = radar.plot_radar(ranges=ranges, params=params, values=values,
                           radar_color=['#B6282F', '#FFFFFF'], title=title)
- Output:
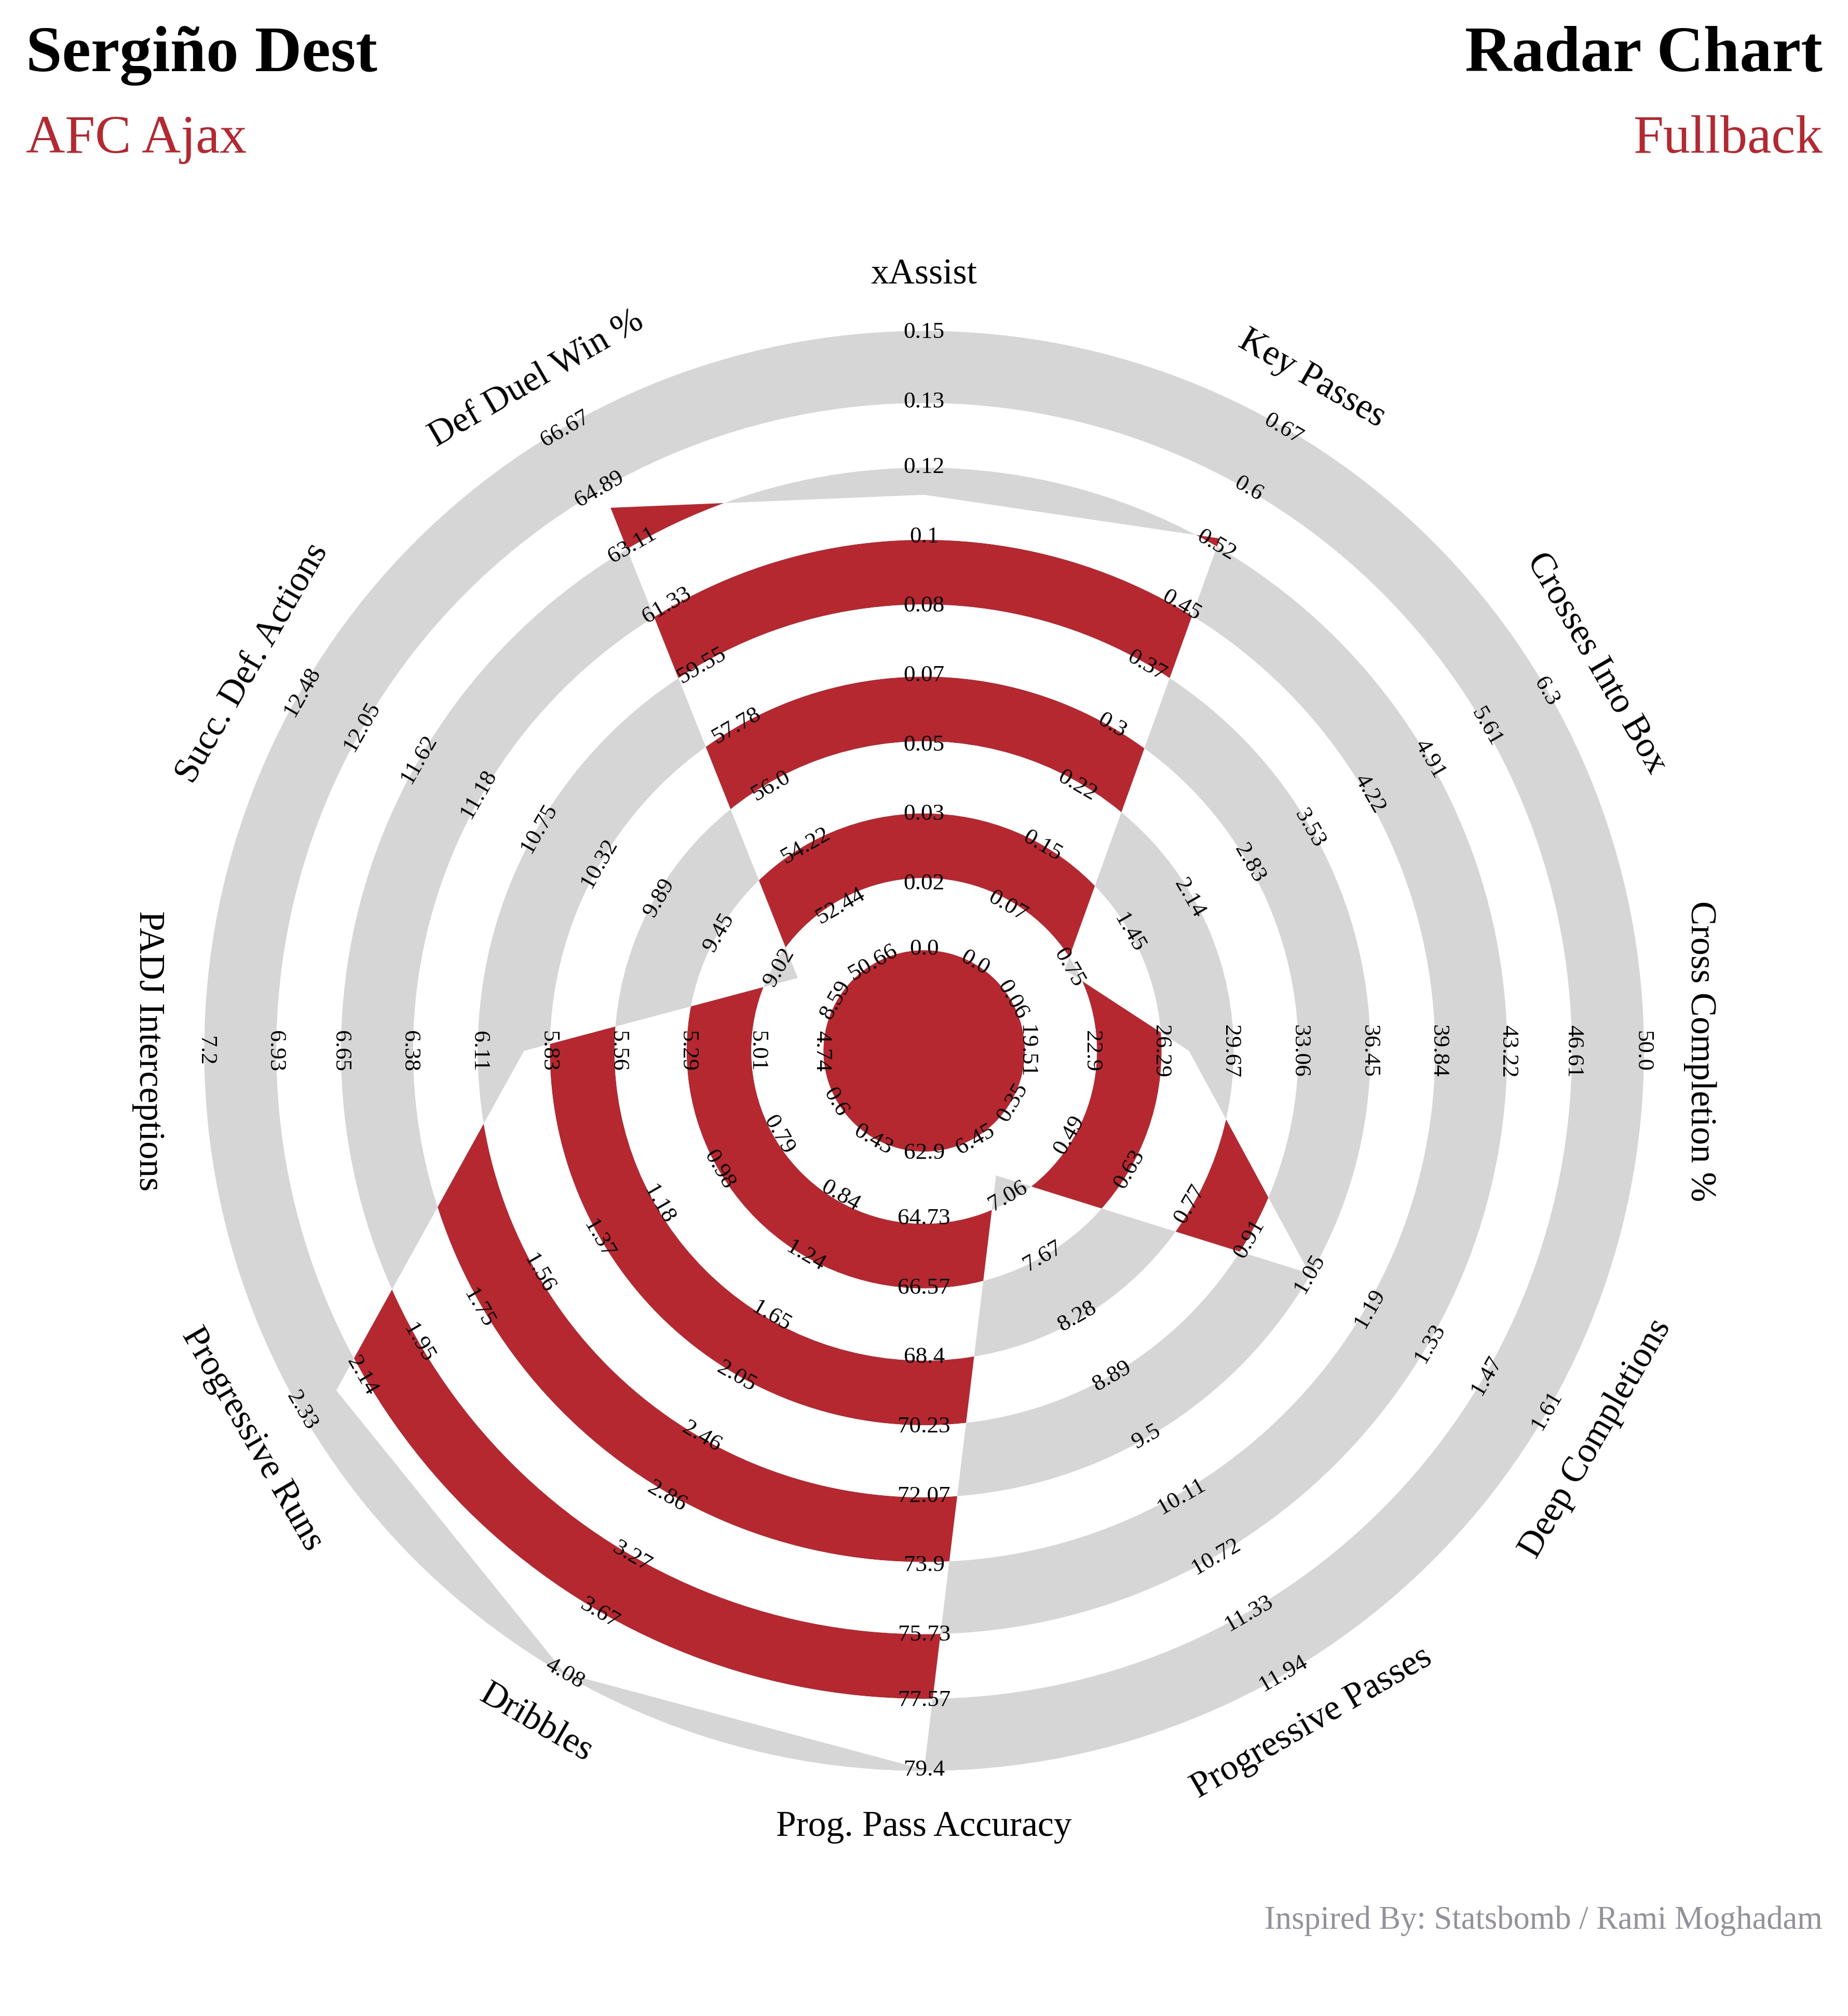
Adding title on both sides
-
Here we will see how to add title on both top-left and top-right sides of the plot using
title. -
Code Snippet:
from soccerplots.radar_chart import Radar

## parameter names
params = ['xAssist', 'Key Passes', 'Crosses Into Box', 'Cross Completion %', 'Deep Completions',
          'Progressive Passes', 'Prog. Pass Accuracy', 'Dribbles', 'Progressive Runs',
          'PADJ Interceptions', 'Succ. Def. Actions', 'Def Duel Win %']

## range values
ranges = [(0.0, 0.15), (0.0, 0.67), (0.06, 6.3), (19.51, 50.0), (0.35, 1.61),
          (6.45, 11.94), (62.9, 79.4), (0.43, 4.08), (0.6, 2.33),
          (4.74, 7.2), (8.59, 12.48), (50.66, 66.67)]

## parameter value
values = [0.11, 0.53, 0.70, 27.66, 1.05, 6.84, 84.62, 4.56, 2.22, 5.93, 8.88, 64.29]

## title values
title = dict(
    title_name='Sergiño Dest',     ## title on left side
    subtitle_name='AFC Ajax',      ## subtitle on left side
    subtitle_color='#B6282F',
    title_name_2='Radar Chart',    ## title on right side
    subtitle_name_2='Fullback',    ## subtitle on right side
    subtitle_color_2='#B6282F',
    title_fontsize=18,             ## same fontsize for both title
    subtitle_fontsize=15,          ## same fontsize for both subtitle
)

## instantiate object
radar = Radar()

## plot radar -- title
fig, ax = radar.plot_radar(ranges=ranges, params=params, values=values,
                           radar_color=['#B6282F', '#FFFFFF'], title=title)
- Output:
-
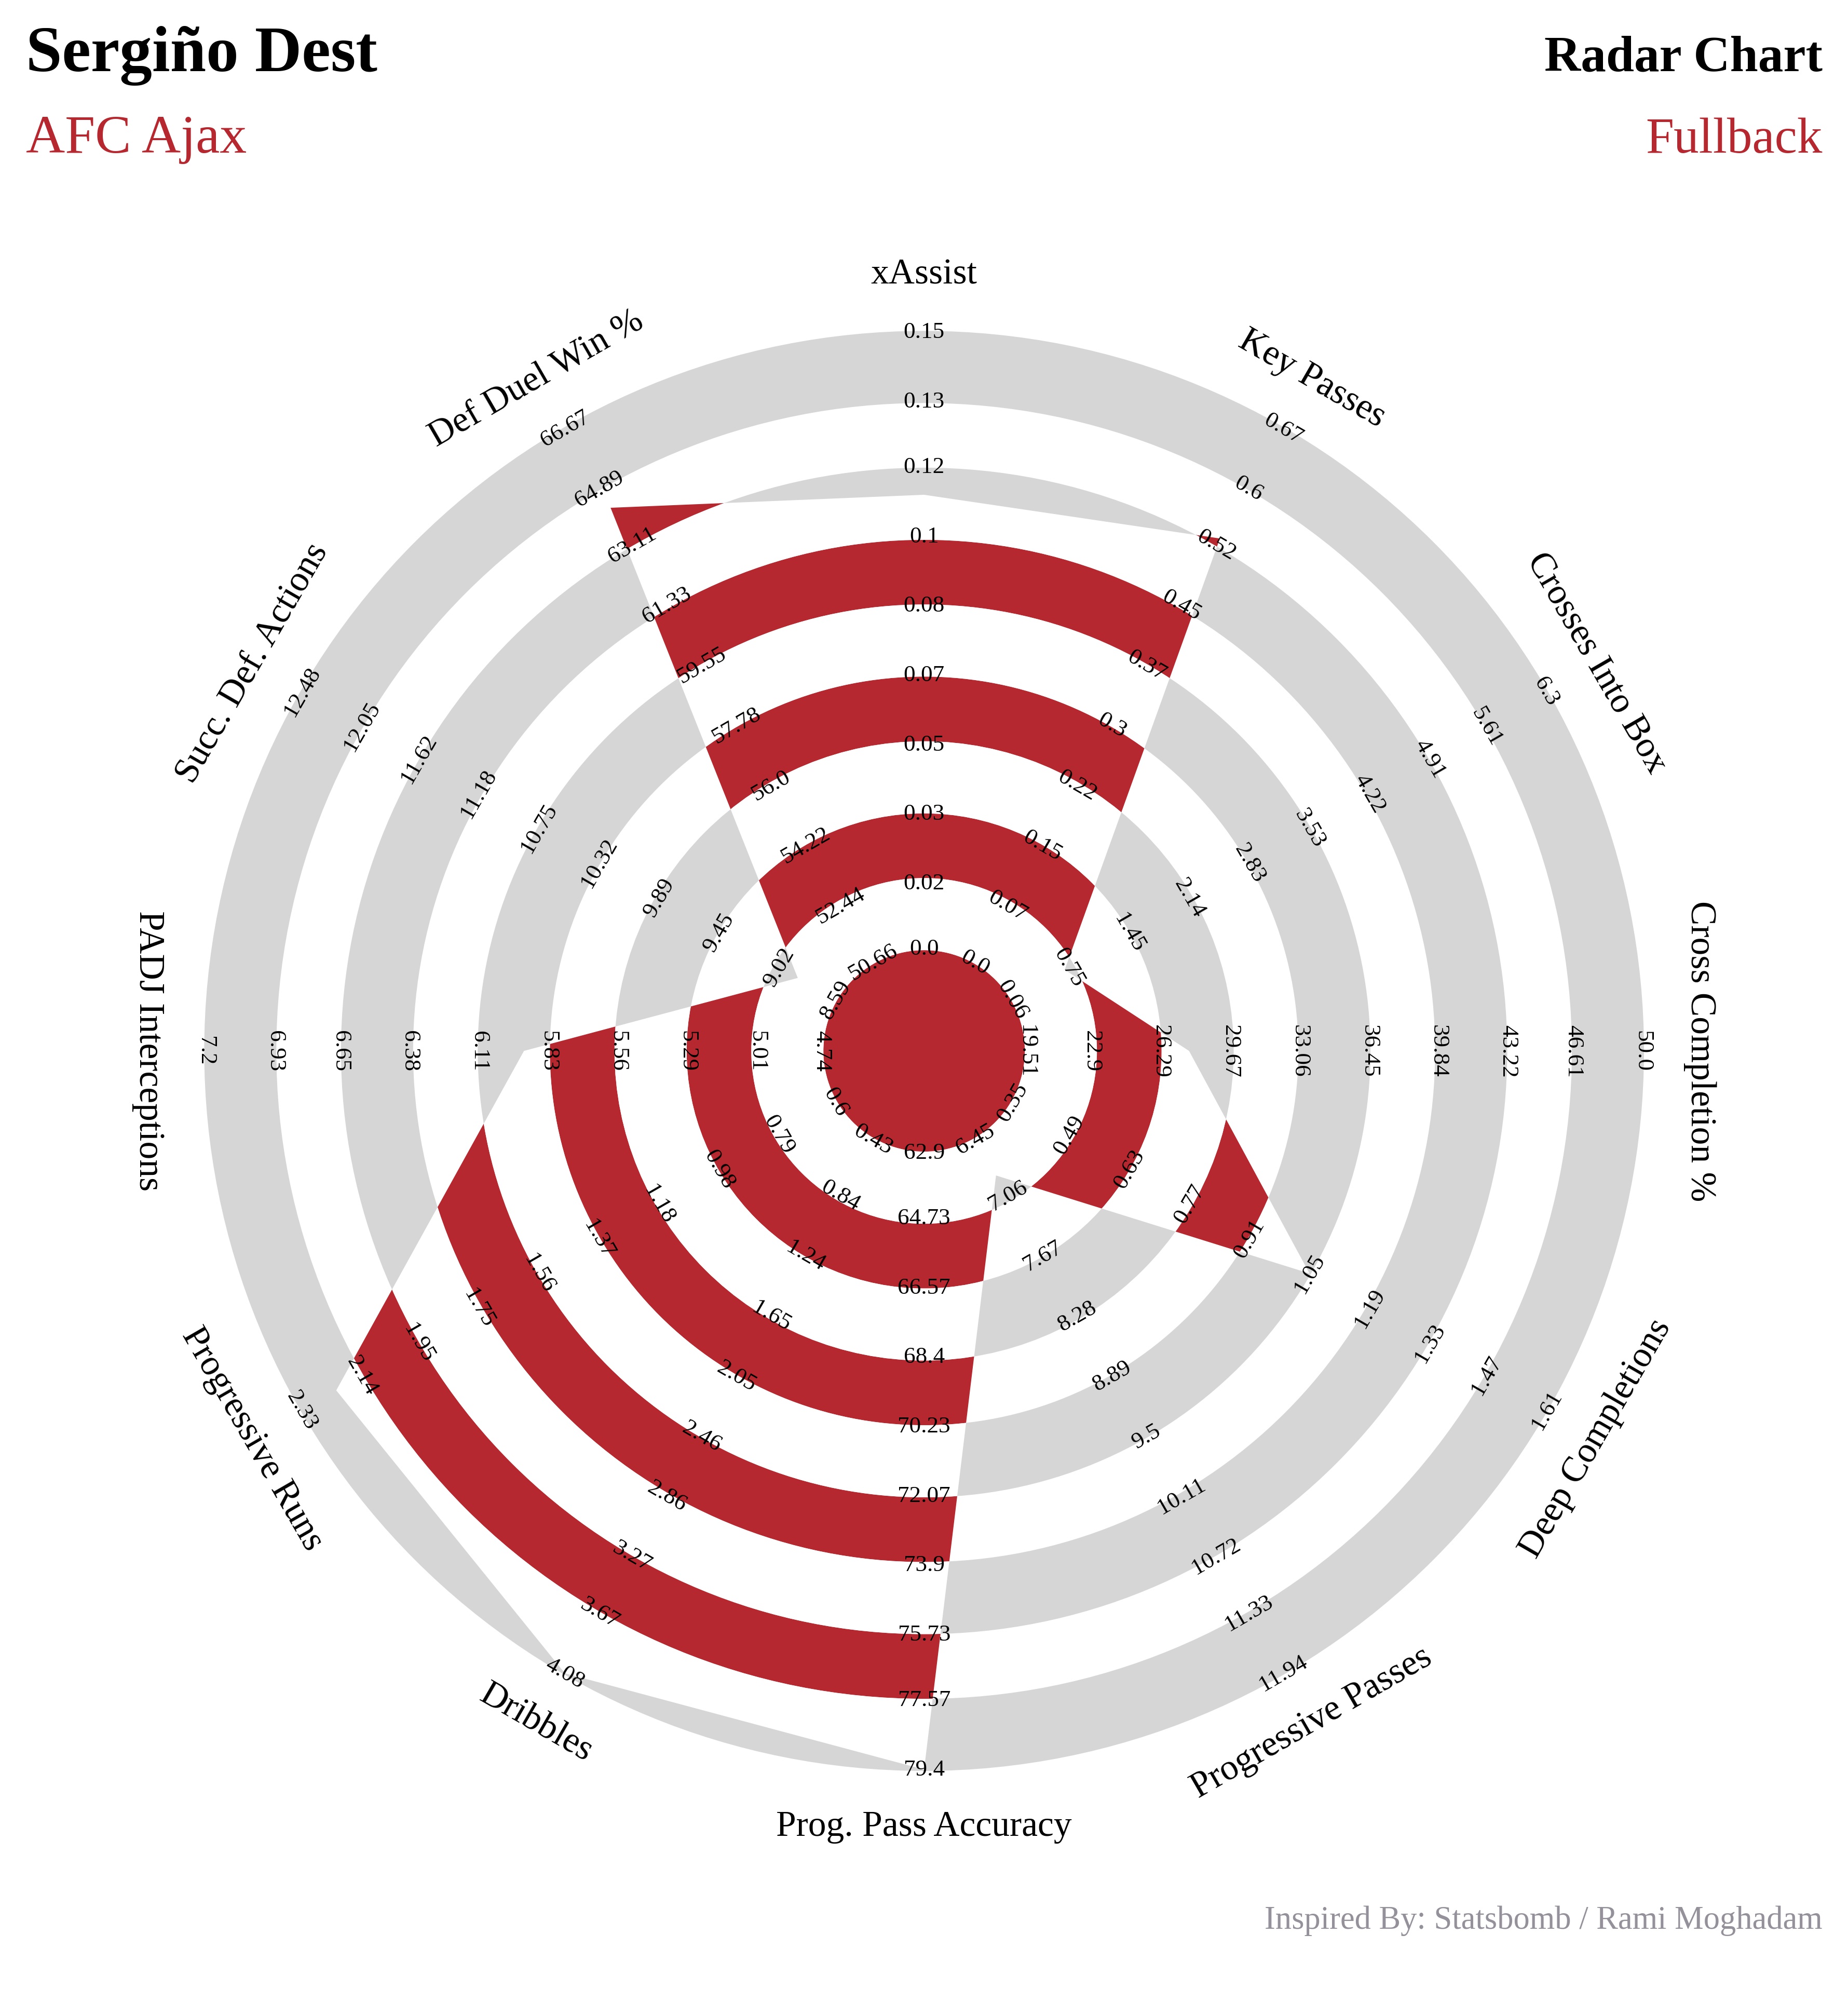
The user can also change the fontsize for top-right title and subtitle. The below code shows how to do it.
-
Code Snippet:
from soccerplots.radar_chart import Radar

## parameter names
params = ['xAssist', 'Key Passes', 'Crosses Into Box', 'Cross Completion %', 'Deep Completions',
          'Progressive Passes', 'Prog. Pass Accuracy', 'Dribbles', 'Progressive Runs',
          'PADJ Interceptions', 'Succ. Def. Actions', 'Def Duel Win %']

## range values
ranges = [(0.0, 0.15), (0.0, 0.67), (0.06, 6.3), (19.51, 50.0), (0.35, 1.61),
          (6.45, 11.94), (62.9, 79.4), (0.43, 4.08), (0.6, 2.33),
          (4.74, 7.2), (8.59, 12.48), (50.66, 66.67)]

## parameter value
values = [0.11, 0.53, 0.70, 27.66, 1.05, 6.84, 84.62, 4.56, 2.22, 5.93, 8.88, 64.29]

## title values
title = dict(
    title_name='Sergiño Dest',
    subtitle_name='AFC Ajax',
    subtitle_color='#B6282F',
    title_name_2='Radar Chart',
    subtitle_name_2='Fullback',
    subtitle_color_2='#B6282F',
    title_fontsize=18,                ## fontsize for left-title
    subtitle_fontsize=15,             ## fontsize for left-subtitle
    title_fontsize_2=14,              ## fontsize for right-title
    subtitle_fontsize_2=14            ## fontsize for right-subtitle
)

## instantiate object
radar = Radar()

## plot radar -- title
fig, ax = radar.plot_radar(ranges=ranges, params=params, values=values,
                           radar_color=['#B6282F', '#FFFFFF'], title=title)
- Output:
Adding Endnote
-
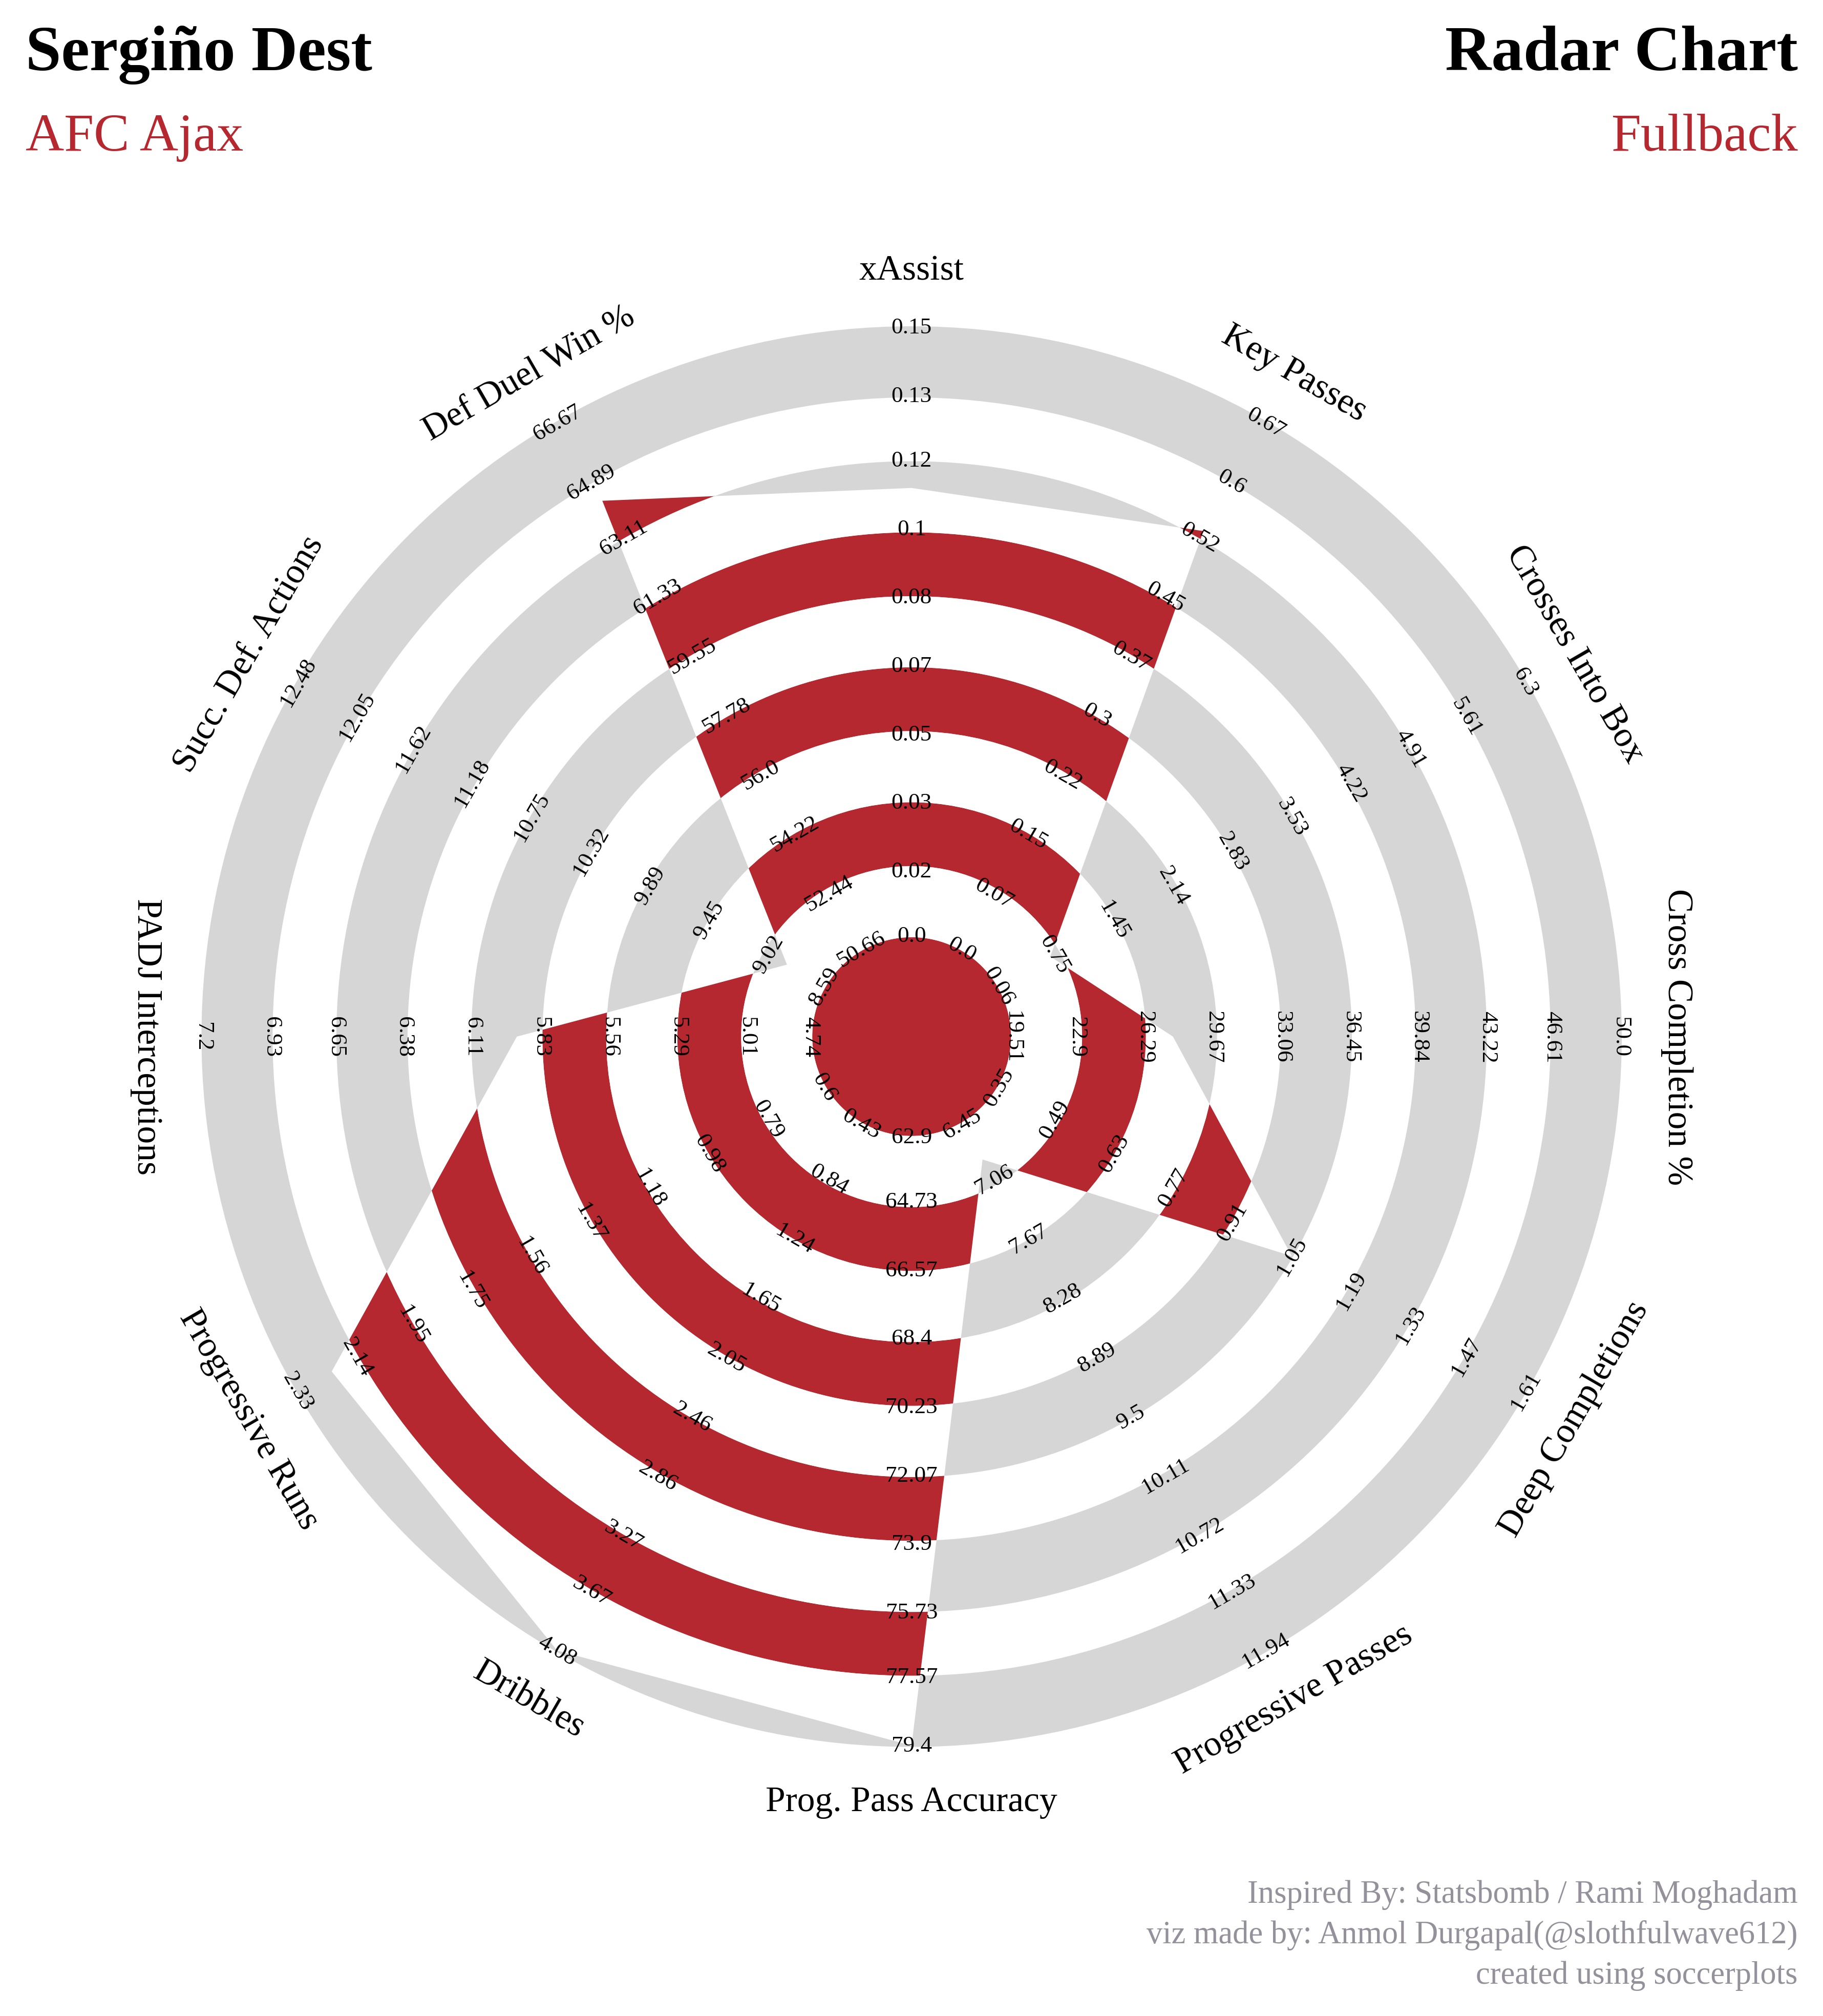
Let's now see how one can add some endnote to the radar chart.
-
Note: The Inspired By endnote will always be there, in order to thank those who developed and popularized it.
-
Code Snippet:
from soccerplots.radar_chart import Radar

## parameter names
params = ['xAssist', 'Key Passes', 'Crosses Into Box', 'Cross Completion %', 'Deep Completions',
          'Progressive Passes', 'Prog. Pass Accuracy', 'Dribbles', 'Progressive Runs',
          'PADJ Interceptions', 'Succ. Def. Actions', 'Def Duel Win %']

## range values
ranges = [(0.0, 0.15), (0.0, 0.67), (0.06, 6.3), (19.51, 50.0), (0.35, 1.61),
          (6.45, 11.94), (62.9, 79.4), (0.43, 4.08), (0.6, 2.33),
          (4.74, 7.2), (8.59, 12.48), (50.66, 66.67)]

## parameter value
values = [0.11, 0.53, 0.70, 27.66, 1.05, 6.84, 84.62, 4.56, 2.22, 5.93, 8.88, 64.29]

## title values
title = dict(
    title_name='Sergiño Dest',
    subtitle_name='AFC Ajax',
    subtitle_color='#B6282F',
    title_name_2='Radar Chart',
    subtitle_name_2='Fullback',
    subtitle_color_2='#B6282F',
    title_fontsize=18,
    subtitle_fontsize=15,
)

## endnote
endnote = "viz made by: Anmol Durgapal(@slothfulwave612)\ncreated using soccerplots"

## instantiate object
radar = Radar()

## plot radar -- endnote
fig, ax = radar.plot_radar(ranges=ranges, params=params, values=values,
                           radar_color=['#B6282F', '#FFFFFF'], title=title,
                          endnote=endnote)
- Output:
Changing the size of endnote
-
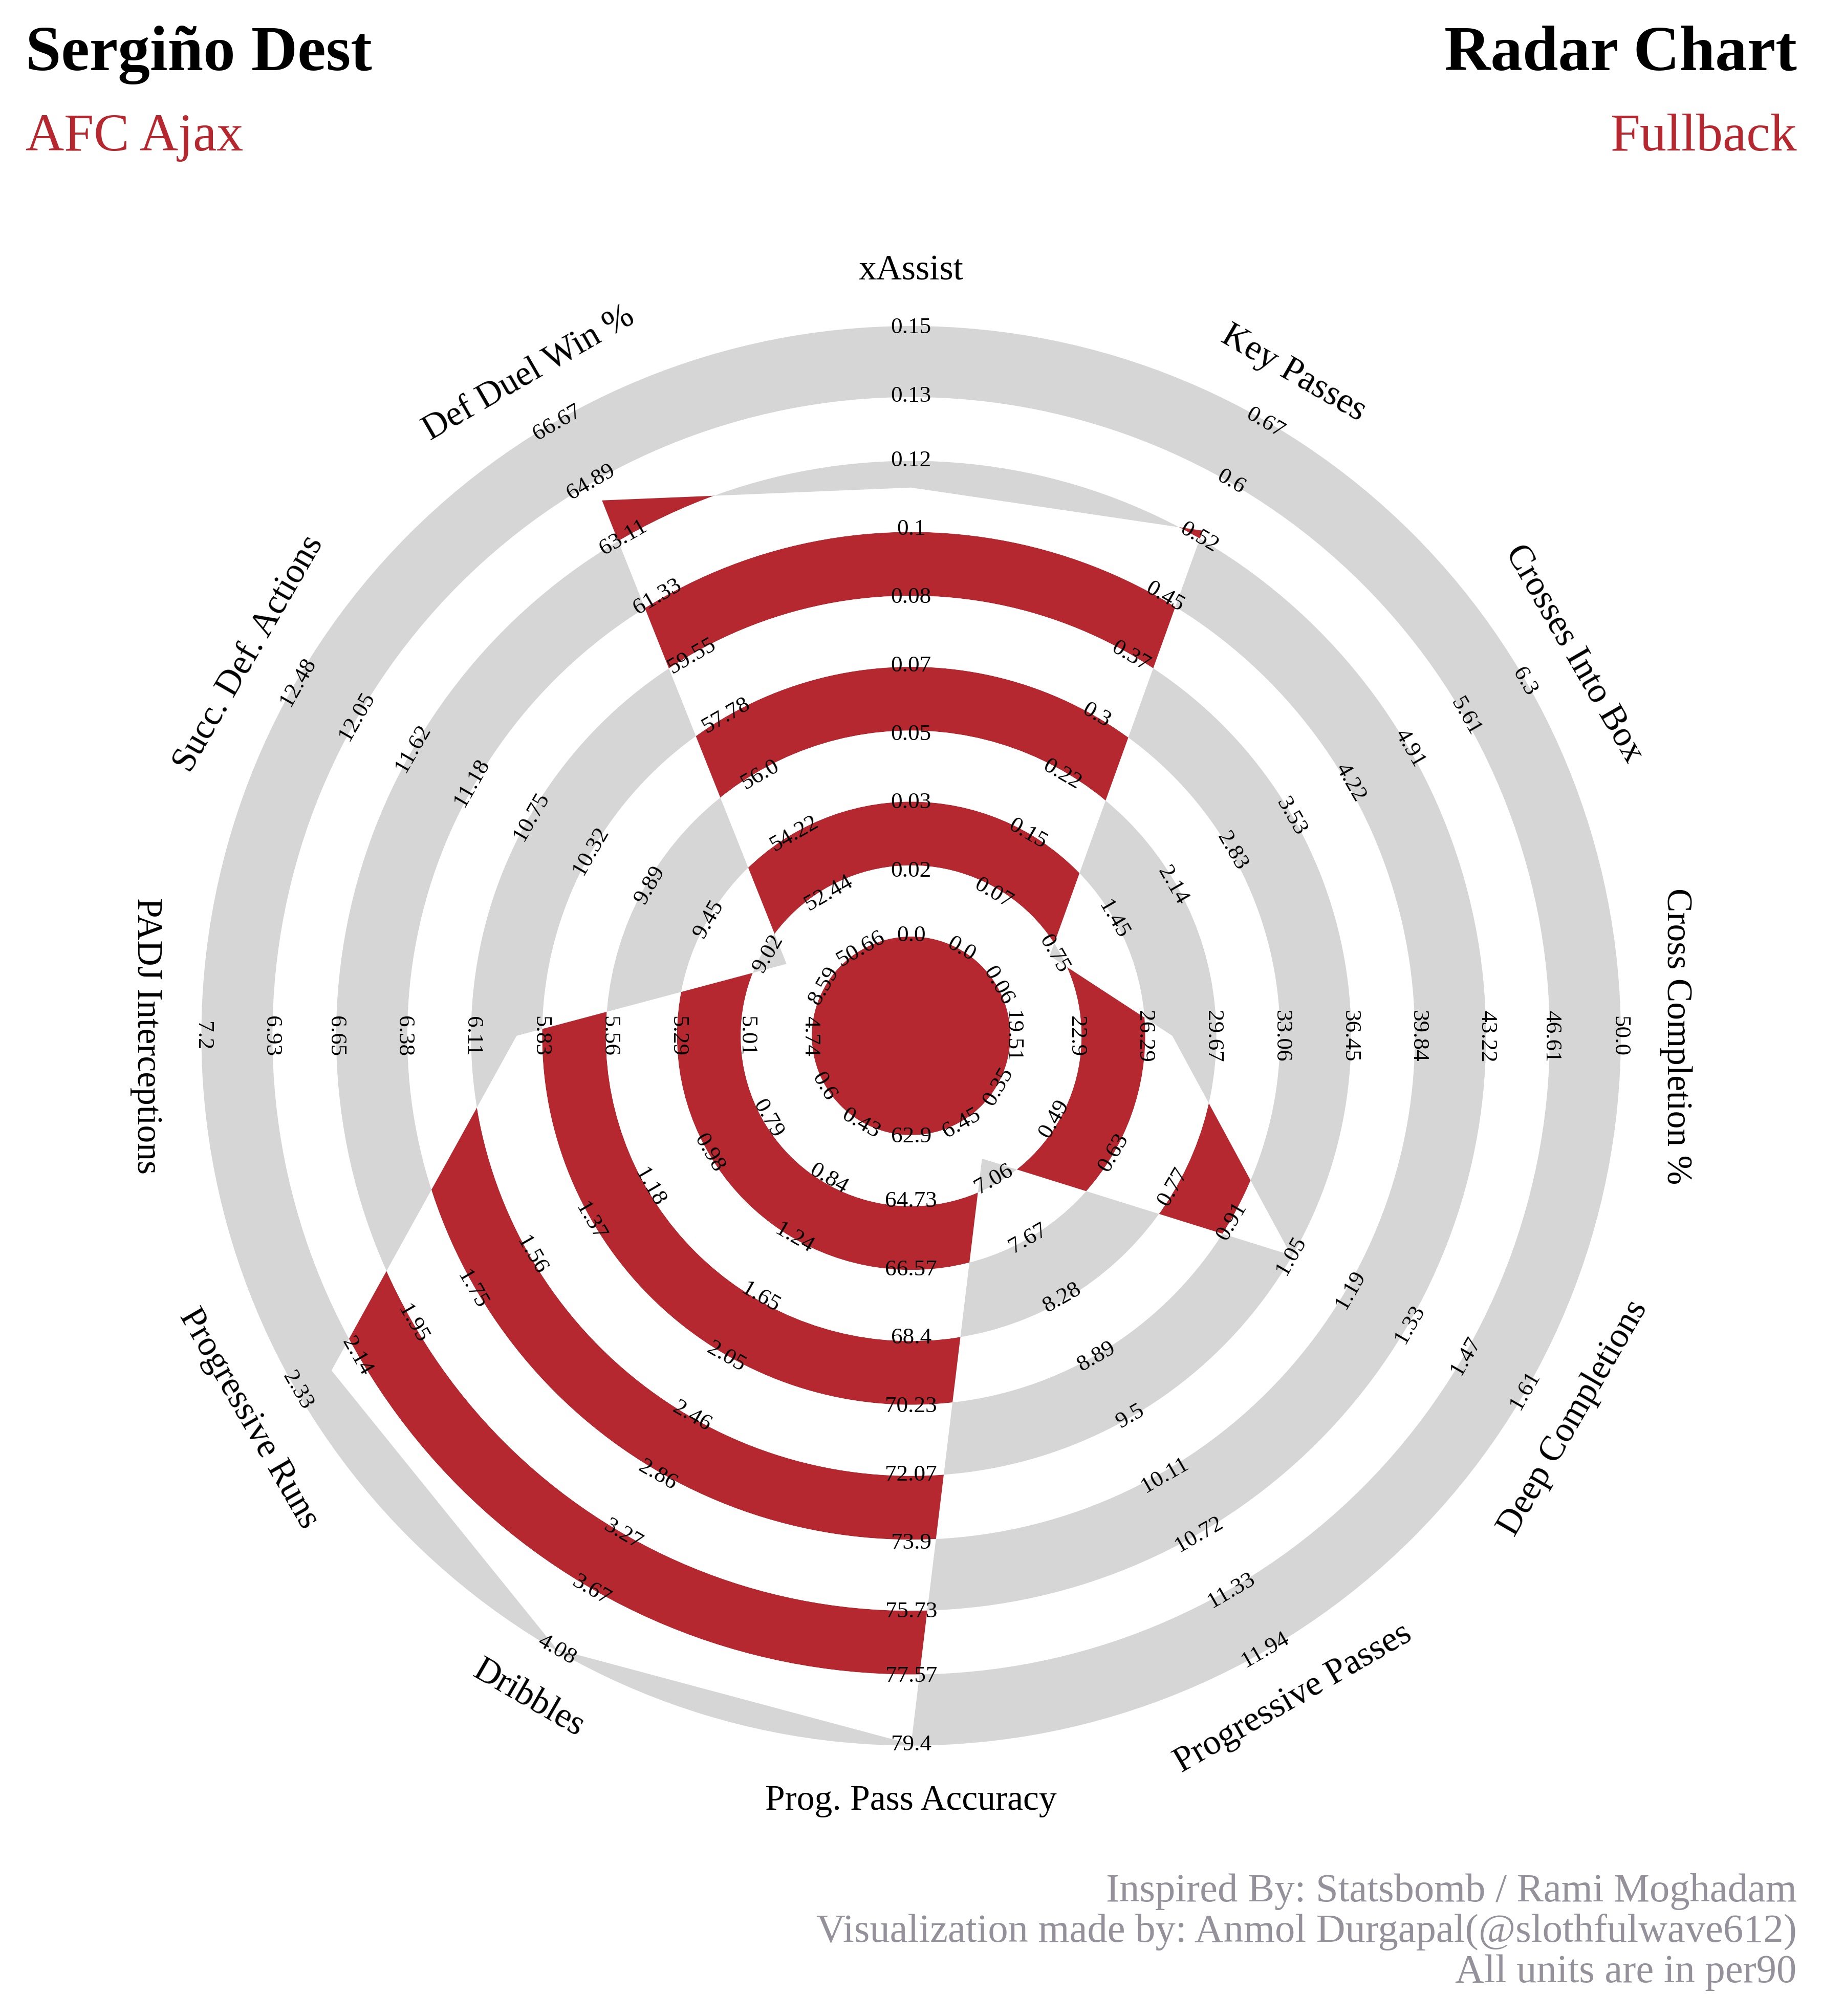
Here we can pass
end_sizeparameter toplot_radarmethod to change the fontsize of endnote. -
Code Snippet:
from soccerplots.radar_chart import Radar

## parameter names
params = ['xAssist', 'Key Passes', 'Crosses Into Box', 'Cross Completion %', 'Deep Completions',
          'Progressive Passes', 'Prog. Pass Accuracy', 'Dribbles', 'Progressive Runs',
          'PADJ Interceptions', 'Succ. Def. Actions', 'Def Duel Win %']

## range values
ranges = [(0.0, 0.15), (0.0, 0.67), (0.06, 6.3), (19.51, 50.0), (0.35, 1.61),
          (6.45, 11.94), (62.9, 79.4), (0.43, 4.08), (0.6, 2.33),
          (4.74, 7.2), (8.59, 12.48), (50.66, 66.67)]

## parameter value
values = [0.11, 0.53, 0.70, 27.66, 1.05, 6.84, 84.62, 4.56, 2.22, 5.93, 8.88, 64.29]

## title values
title = dict(
    title_name='Sergiño Dest',
    subtitle_name='AFC Ajax',
    subtitle_color='#B6282F',
    title_name_2='Radar Chart',
    subtitle_name_2='Fullback',
    subtitle_color_2='#B6282F',
    title_fontsize=18,
    subtitle_fontsize=15,
)

## endnote
endnote = "Visualization made by: Anmol Durgapal(@slothfulwave612)\nAll units are in per90"

## instantiate object
radar = Radar()

## plot radar -- end_size
fig, ax = radar.plot_radar(ranges=ranges, params=params, values=values,
                           radar_color=['#B6282F', '#FFFFFF'], title=title,
                          endnote=endnote, end_size=11.3)
- Output:
Changing color of endnote
-
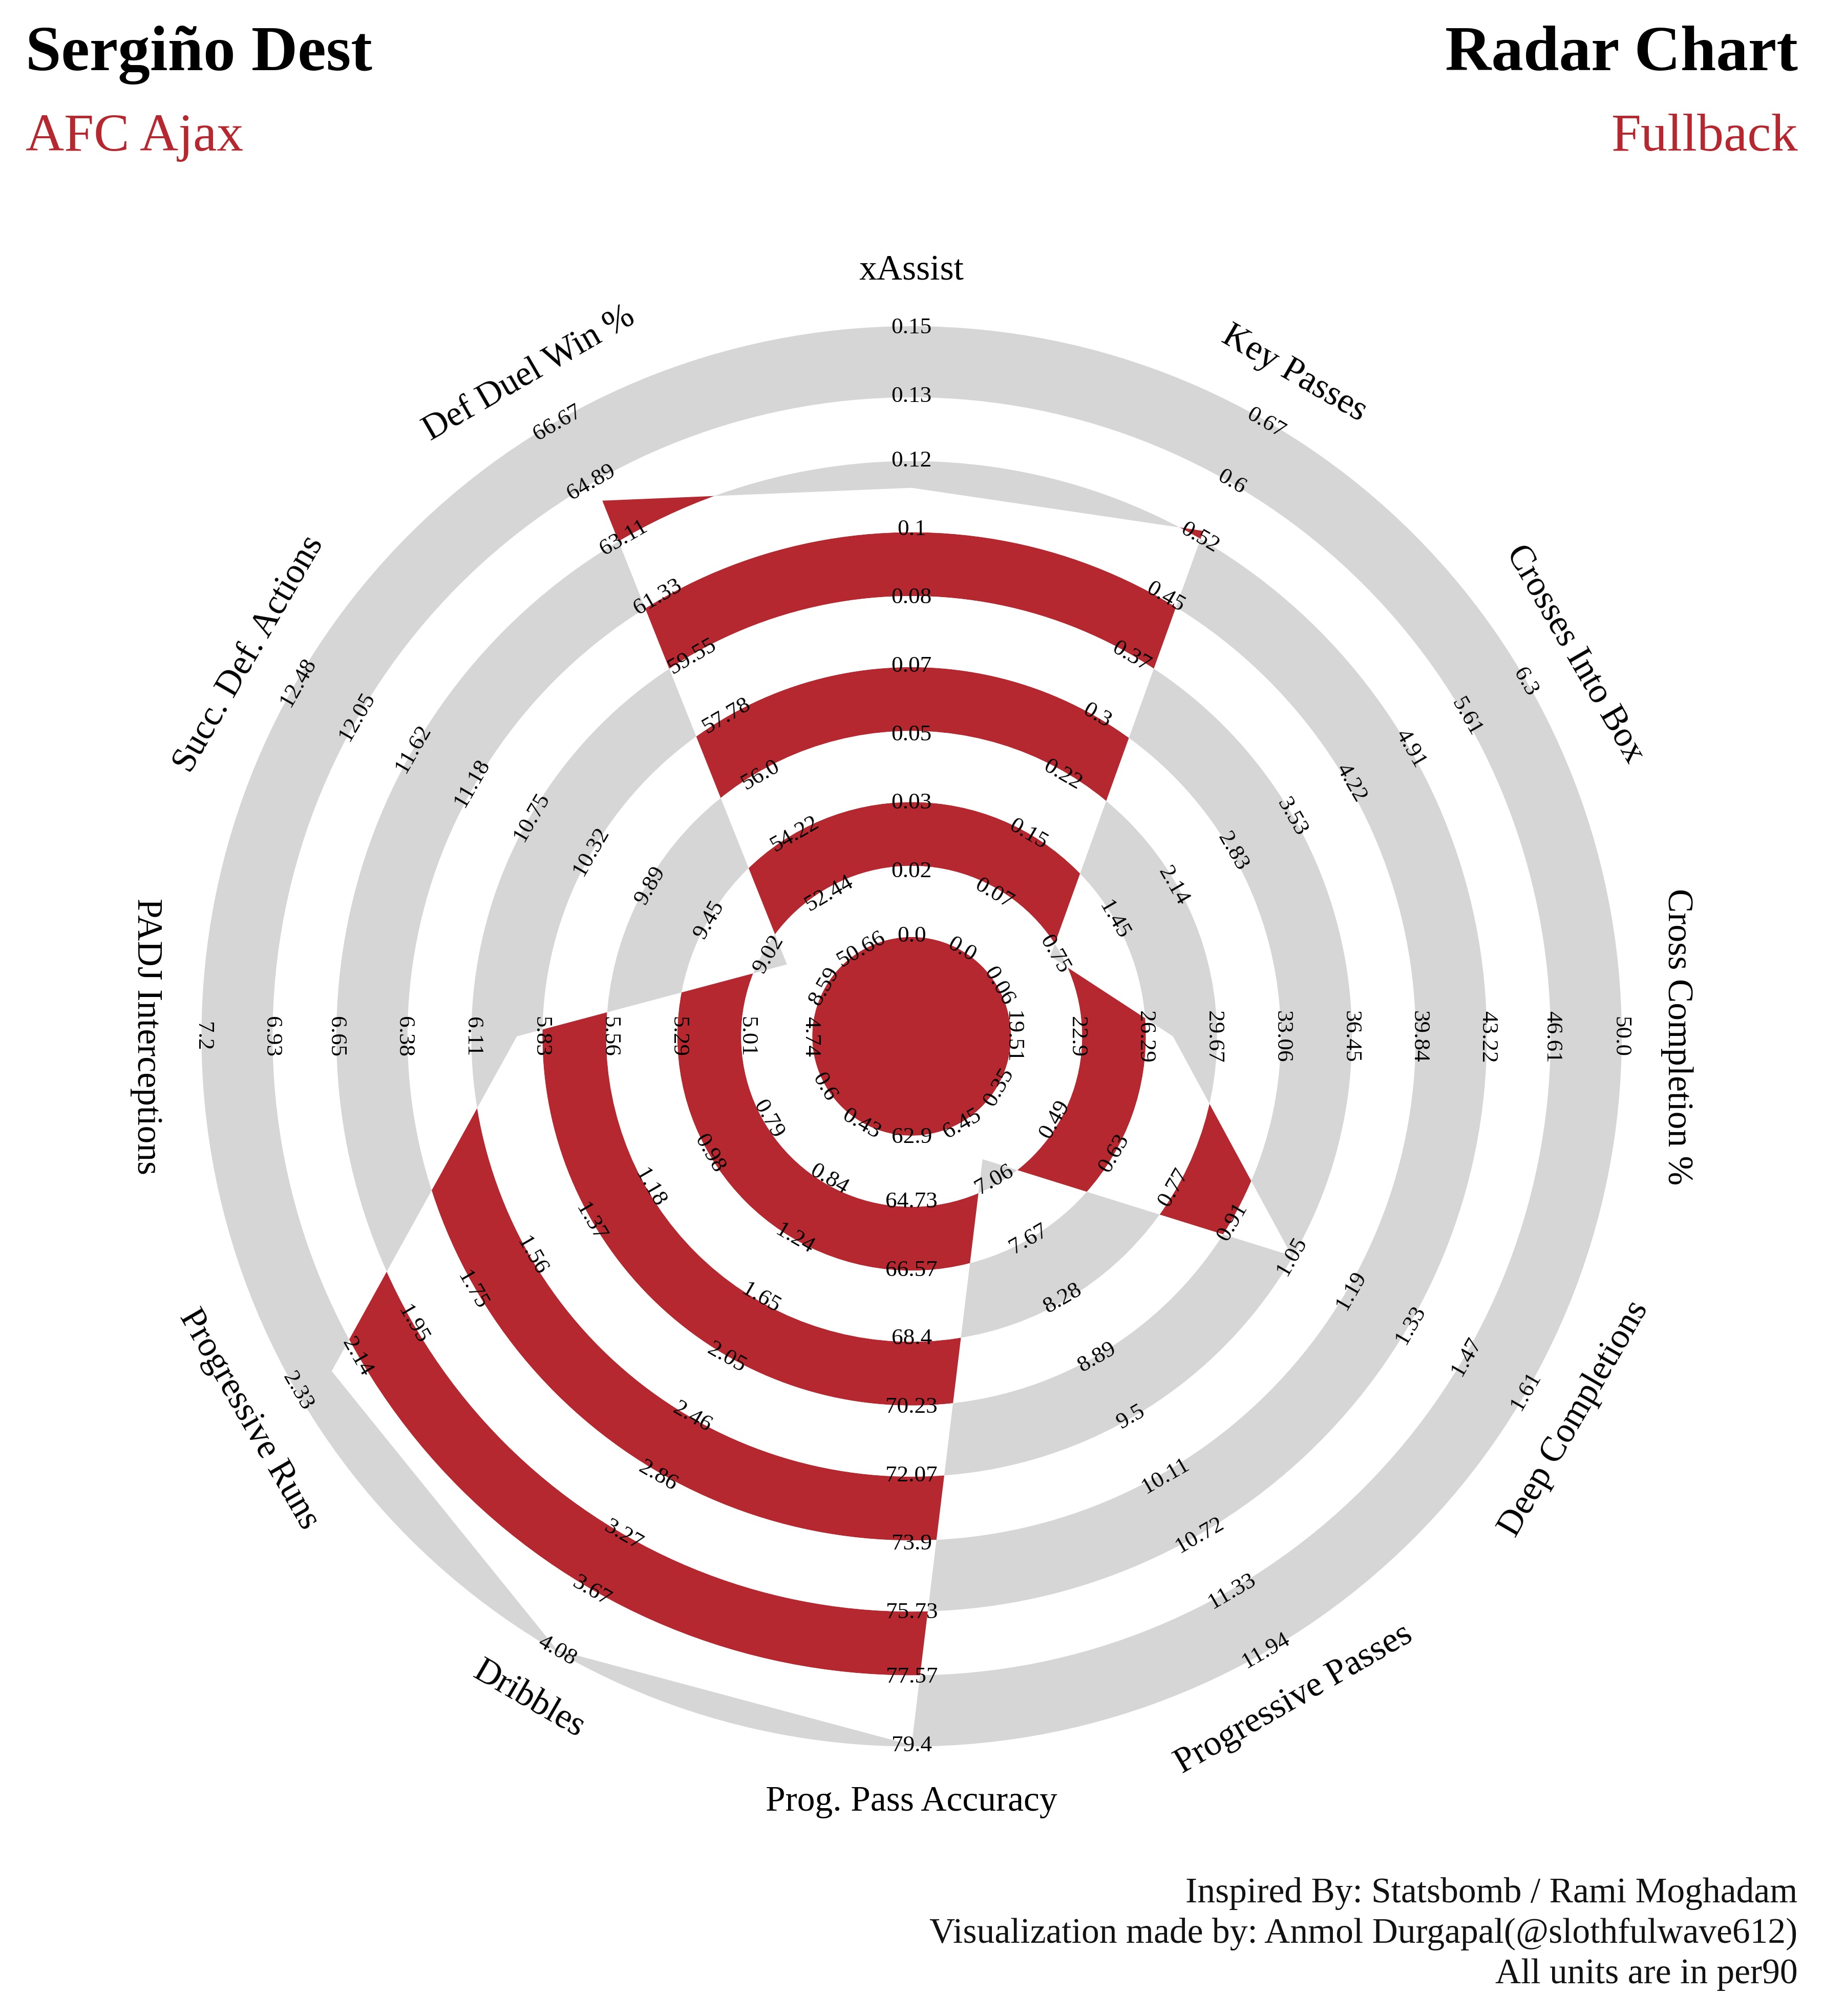
We can pass
end_colorargument in order to change the color of endnote. -
Code Snippet:
from soccerplots.radar_chart import Radar

## parameter names
params = ['xAssist', 'Key Passes', 'Crosses Into Box', 'Cross Completion %', 'Deep Completions',
          'Progressive Passes', 'Prog. Pass Accuracy', 'Dribbles', 'Progressive Runs',
          'PADJ Interceptions', 'Succ. Def. Actions', 'Def Duel Win %']

## range values
ranges = [(0.0, 0.15), (0.0, 0.67), (0.06, 6.3), (19.51, 50.0), (0.35, 1.61),
          (6.45, 11.94), (62.9, 79.4), (0.43, 4.08), (0.6, 2.33),
          (4.74, 7.2), (8.59, 12.48), (50.66, 66.67)]

## parameter value
values = [0.11, 0.53, 0.70, 27.66, 1.05, 6.84, 84.62, 4.56, 2.22, 5.93, 8.88, 64.29]

## title values
title = dict(
    title_name='Sergiño Dest',
    subtitle_name='AFC Ajax',
    subtitle_color='#B6282F',
    title_name_2='Radar Chart',
    subtitle_name_2='Fullback',
    subtitle_color_2='#B6282F',
    title_fontsize=18,
    subtitle_fontsize=15,
)

## endnote
endnote = "Visualization made by: Anmol Durgapal(@slothfulwave612)\nAll units are in per90"

## instantiate object
radar = Radar()

## plot radar -- end_color
fig, ax = radar.plot_radar(ranges=ranges, params=params, values=values,
                           radar_color=['#B6282F', '#FFFFFF'], title=title,
                          endnote=endnote, end_size=10, end_color="#121212")
- Output:
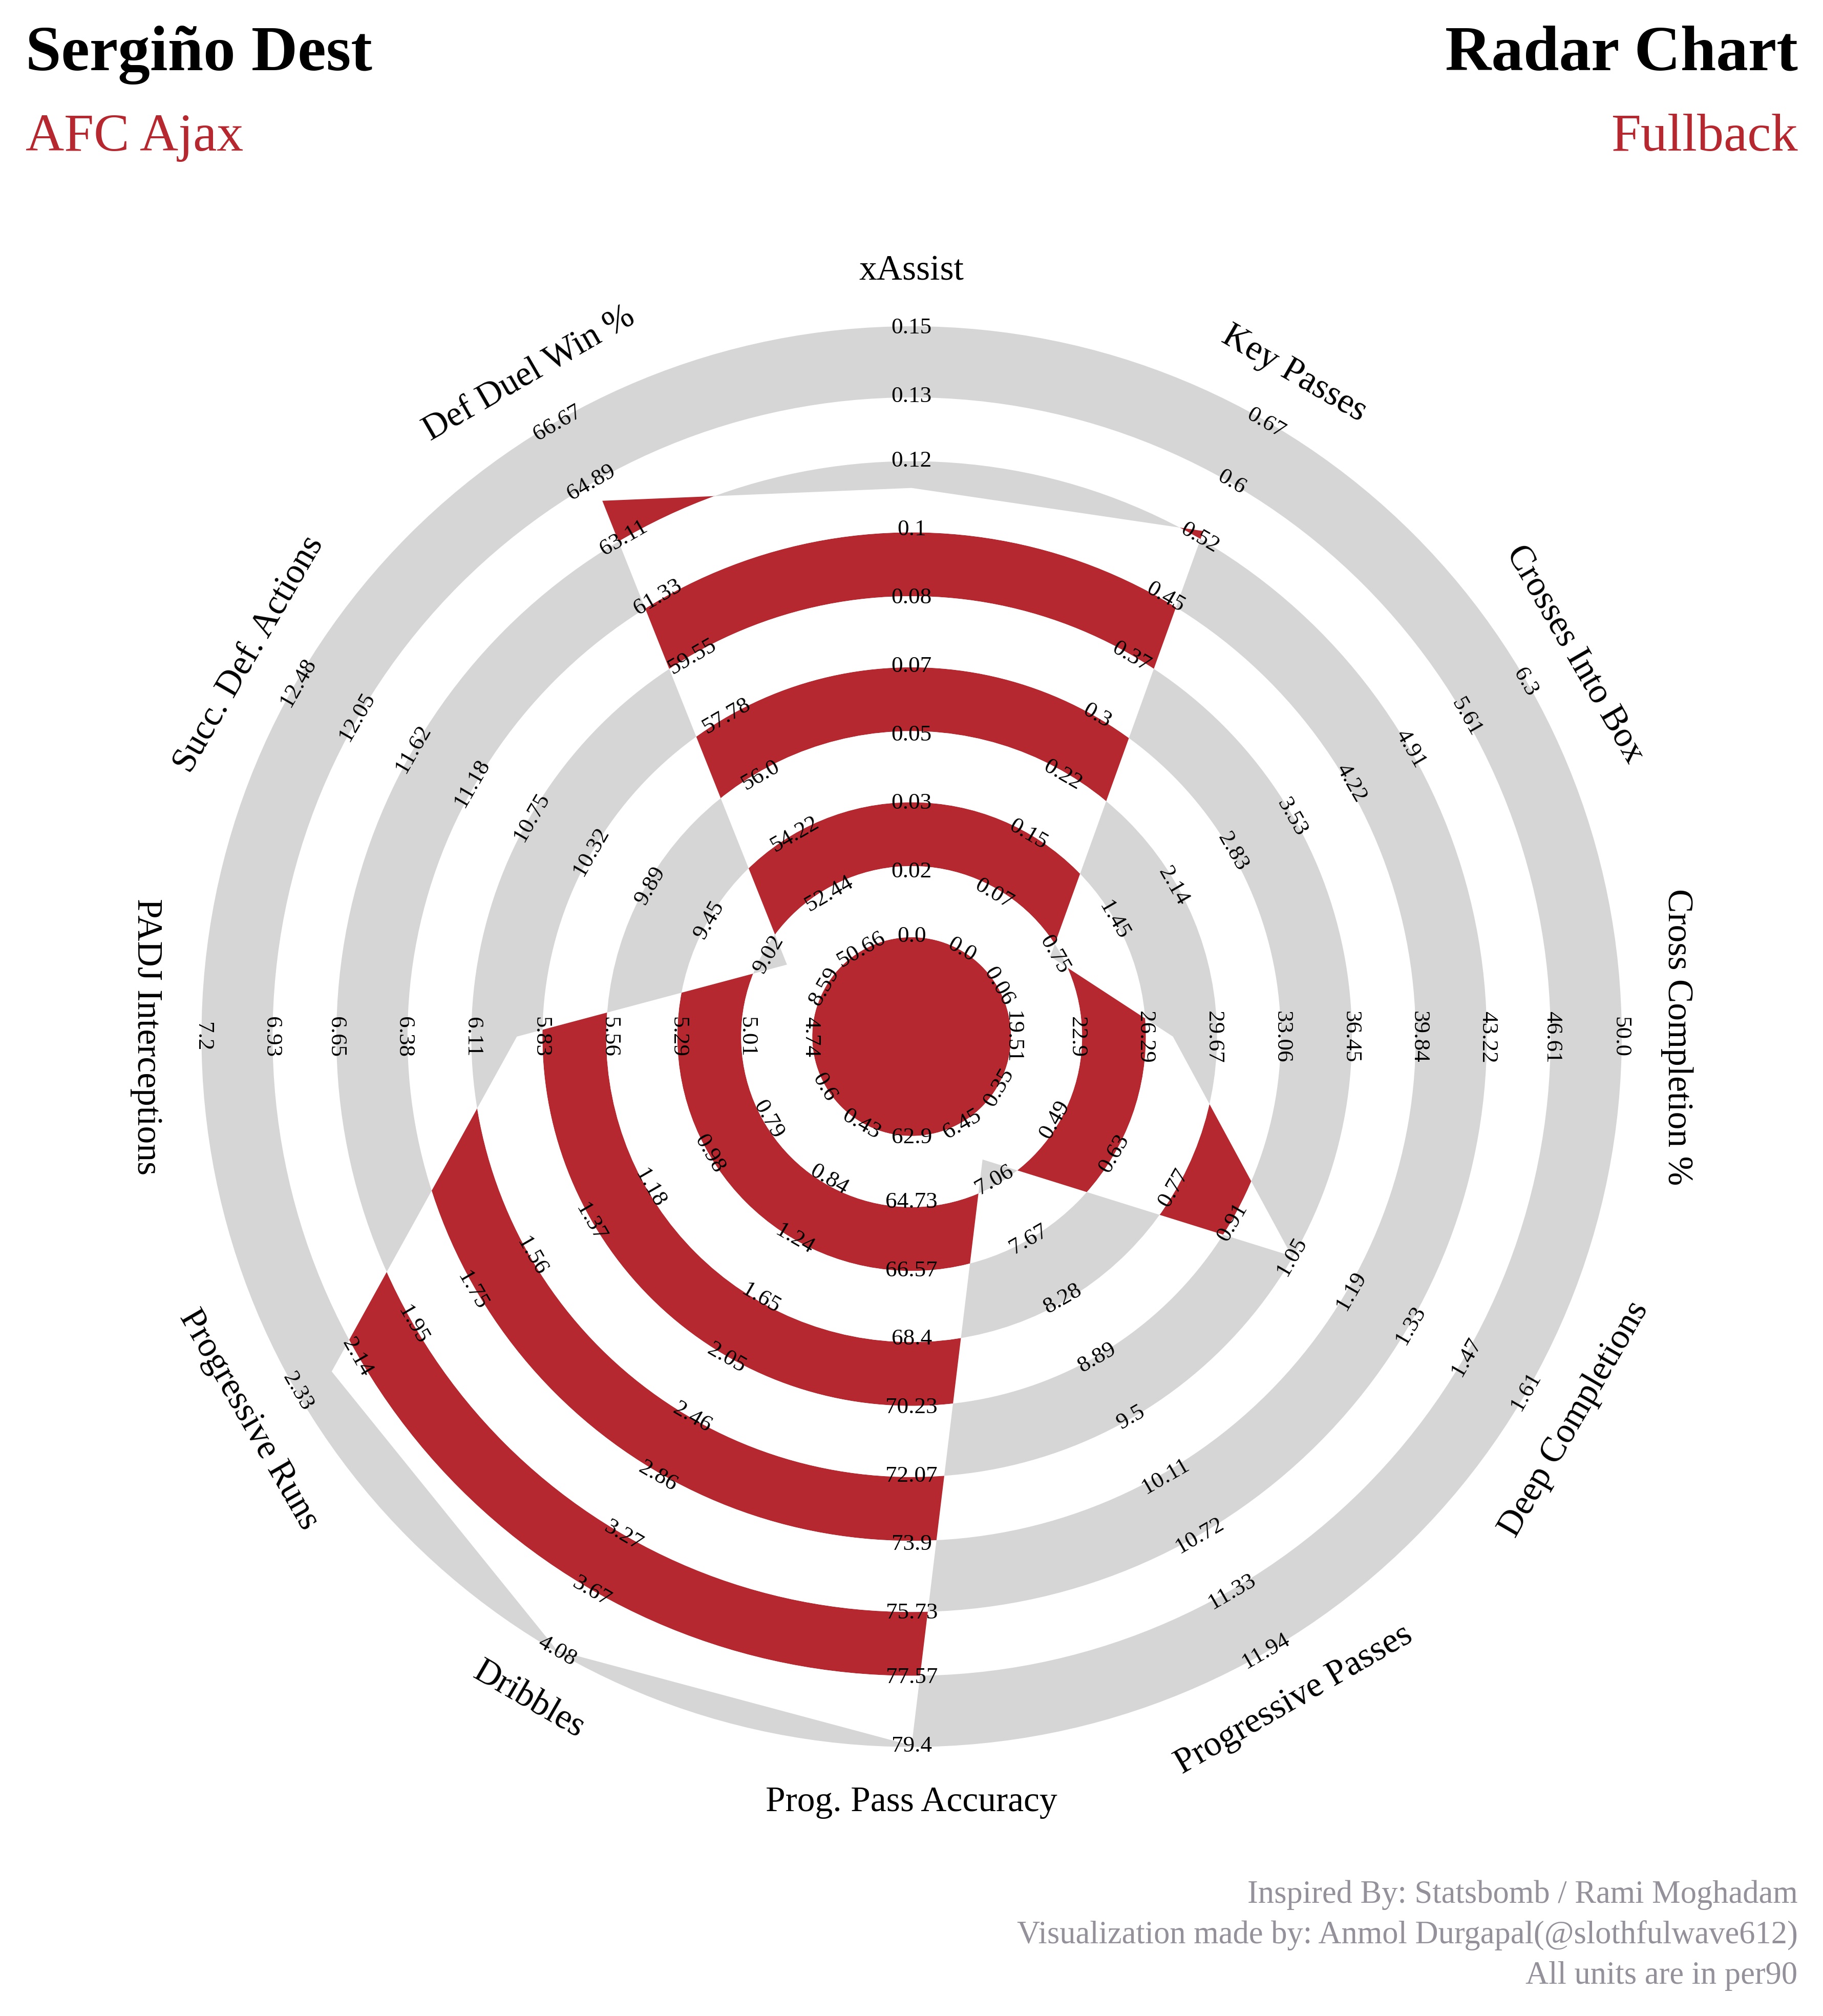
Saving radar chart
-
One can pass
filenameargument inplot_radarmethod to save the radar chart. -
Code Snippet:
from soccerplots.radar_chart import Radar

## parameter names
params = ['xAssist', 'Key Passes', 'Crosses Into Box', 'Cross Completion %', 'Deep Completions',
          'Progressive Passes', 'Prog. Pass Accuracy', 'Dribbles', 'Progressive Runs',
          'PADJ Interceptions', 'Succ. Def. Actions', 'Def Duel Win %']

## range values
ranges = [(0.0, 0.15), (0.0, 0.67), (0.06, 6.3), (19.51, 50.0), (0.35, 1.61),
          (6.45, 11.94), (62.9, 79.4), (0.43, 4.08), (0.6, 2.33),
          (4.74, 7.2), (8.59, 12.48), (50.66, 66.67)]

## parameter value
values = [0.11, 0.53, 0.70, 27.66, 1.05, 6.84, 84.62, 4.56, 2.22, 5.93, 8.88, 64.29]

## title values
title = dict(
    title_name='Sergiño Dest',
    subtitle_name='AFC Ajax',
    subtitle_color='#B6282F',
    title_name_2='Radar Chart',
    subtitle_name_2='Fullback',
    subtitle_color_2='#B6282F',
    title_fontsize=18,
    subtitle_fontsize=15,
)

## endnote
endnote = "Visualization made by: Anmol Durgapal(@slothfulwave612)\nAll units are in per90"

## instantiate object
radar = Radar()

## plot radar -- filename
fig, ax = radar.plot_radar(ranges=ranges, params=params, values=values,
                           radar_color=['#B6282F', '#FFFFFF'], title=title,
                           endnote=endnote,
                           filename="my_radar.jpg")
- Output:
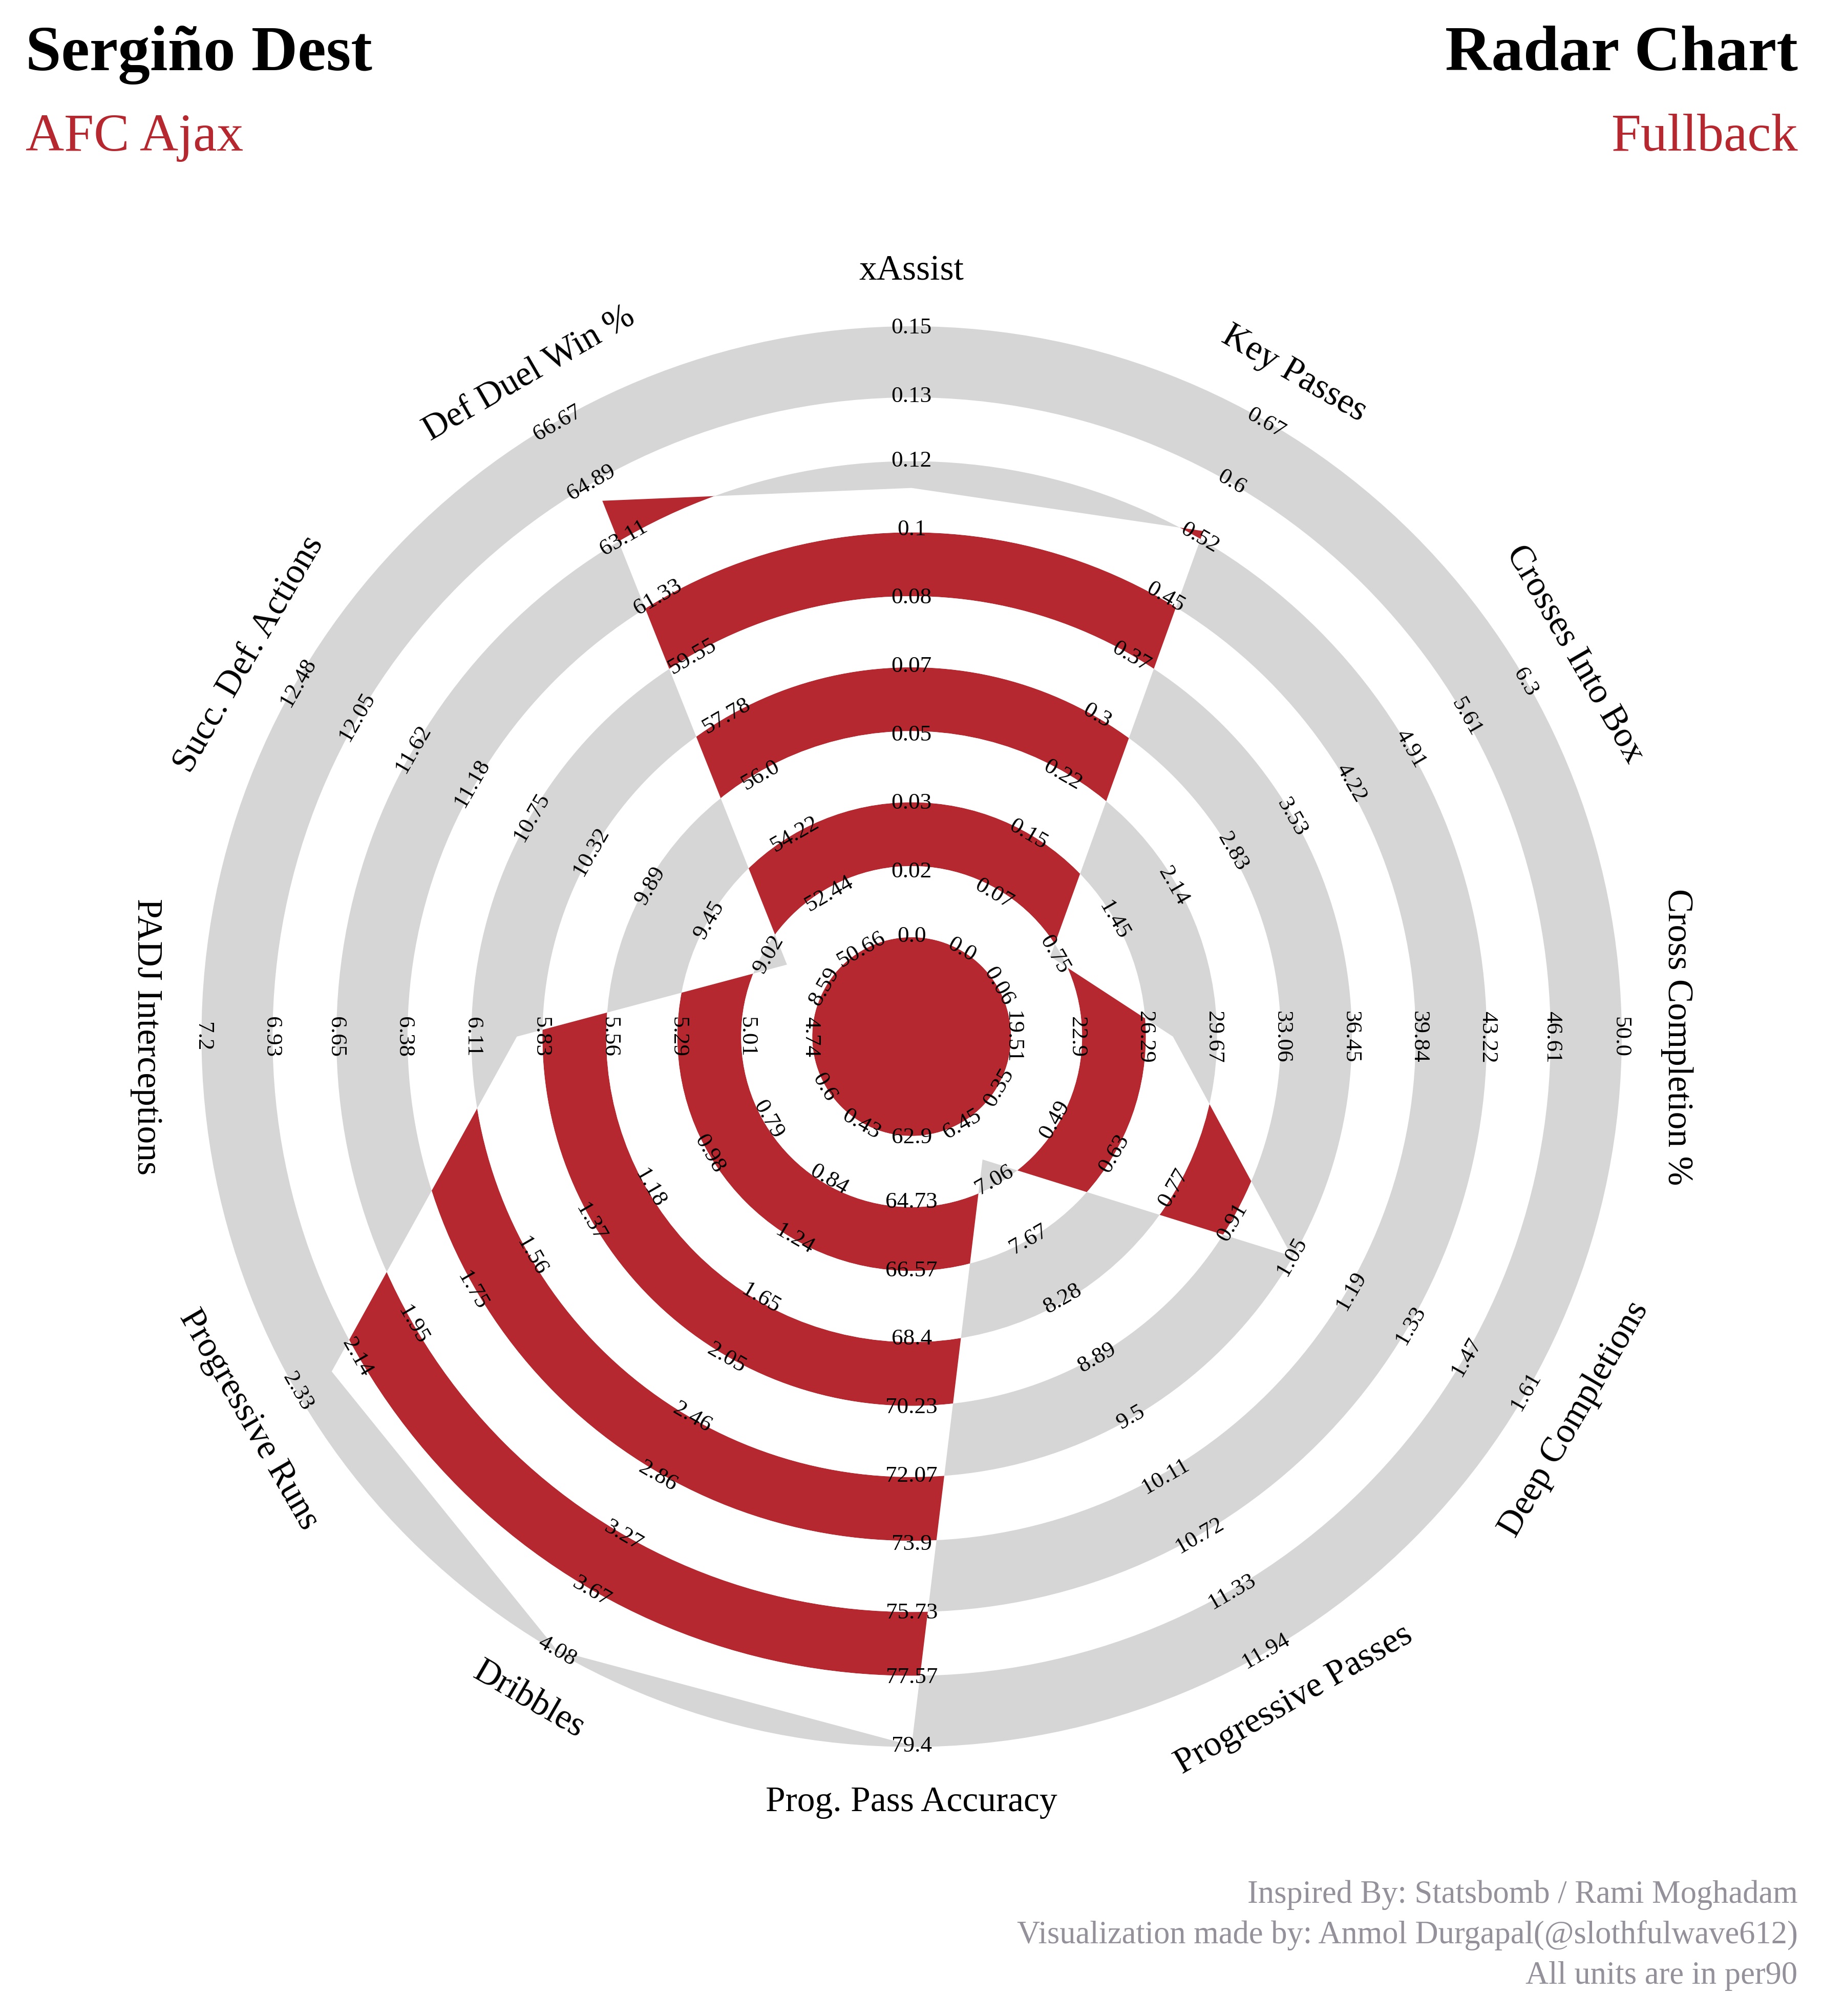
Changing dpi
-
dpi or Dots per Inch.
-
We can increase or decrease the resolution of our plot by passing in the
dpiparameter toplot_radarmethod. More the dpi better the plot looks(high-resolution). -
Code Snippet:
from soccerplots.radar_chart import Radar

## parameter names
params = ['xAssist', 'Key Passes', 'Crosses Into Box', 'Cross Completion %', 'Deep Completions',
          'Progressive Passes', 'Prog. Pass Accuracy', 'Dribbles', 'Progressive Runs',
          'PADJ Interceptions', 'Succ. Def. Actions', 'Def Duel Win %']

## range values
ranges = [(0.0, 0.15), (0.0, 0.67), (0.06, 6.3), (19.51, 50.0), (0.35, 1.61),
          (6.45, 11.94), (62.9, 79.4), (0.43, 4.08), (0.6, 2.33),
          (4.74, 7.2), (8.59, 12.48), (50.66, 66.67)]

## parameter value
values = [0.11, 0.53, 0.70, 27.66, 1.05, 6.84, 84.62, 4.56, 2.22, 5.93, 8.88, 64.29]

## title values
title = dict(
    title_name='Sergiño Dest',
    subtitle_name='AFC Ajax',
    subtitle_color='#B6282F',
    title_name_2='Radar Chart',
    subtitle_name_2='Fullback',
    subtitle_color_2='#B6282F',
    title_fontsize=18,
    subtitle_fontsize=15,
)

## endnote
endnote = "Visualization made by: Anmol Durgapal(@slothfulwave612)\nAll units are in per90"

## instantiate object
radar = Radar()

## plot radar -- filename and dpi
fig, ax = radar.plot_radar(ranges=ranges, params=params, values=values,
                           radar_color=['#B6282F', '#FFFFFF'], title=title,
                           endnote=endnote,
                           filename="my_radar.jpg", dpi=500)
- Output:
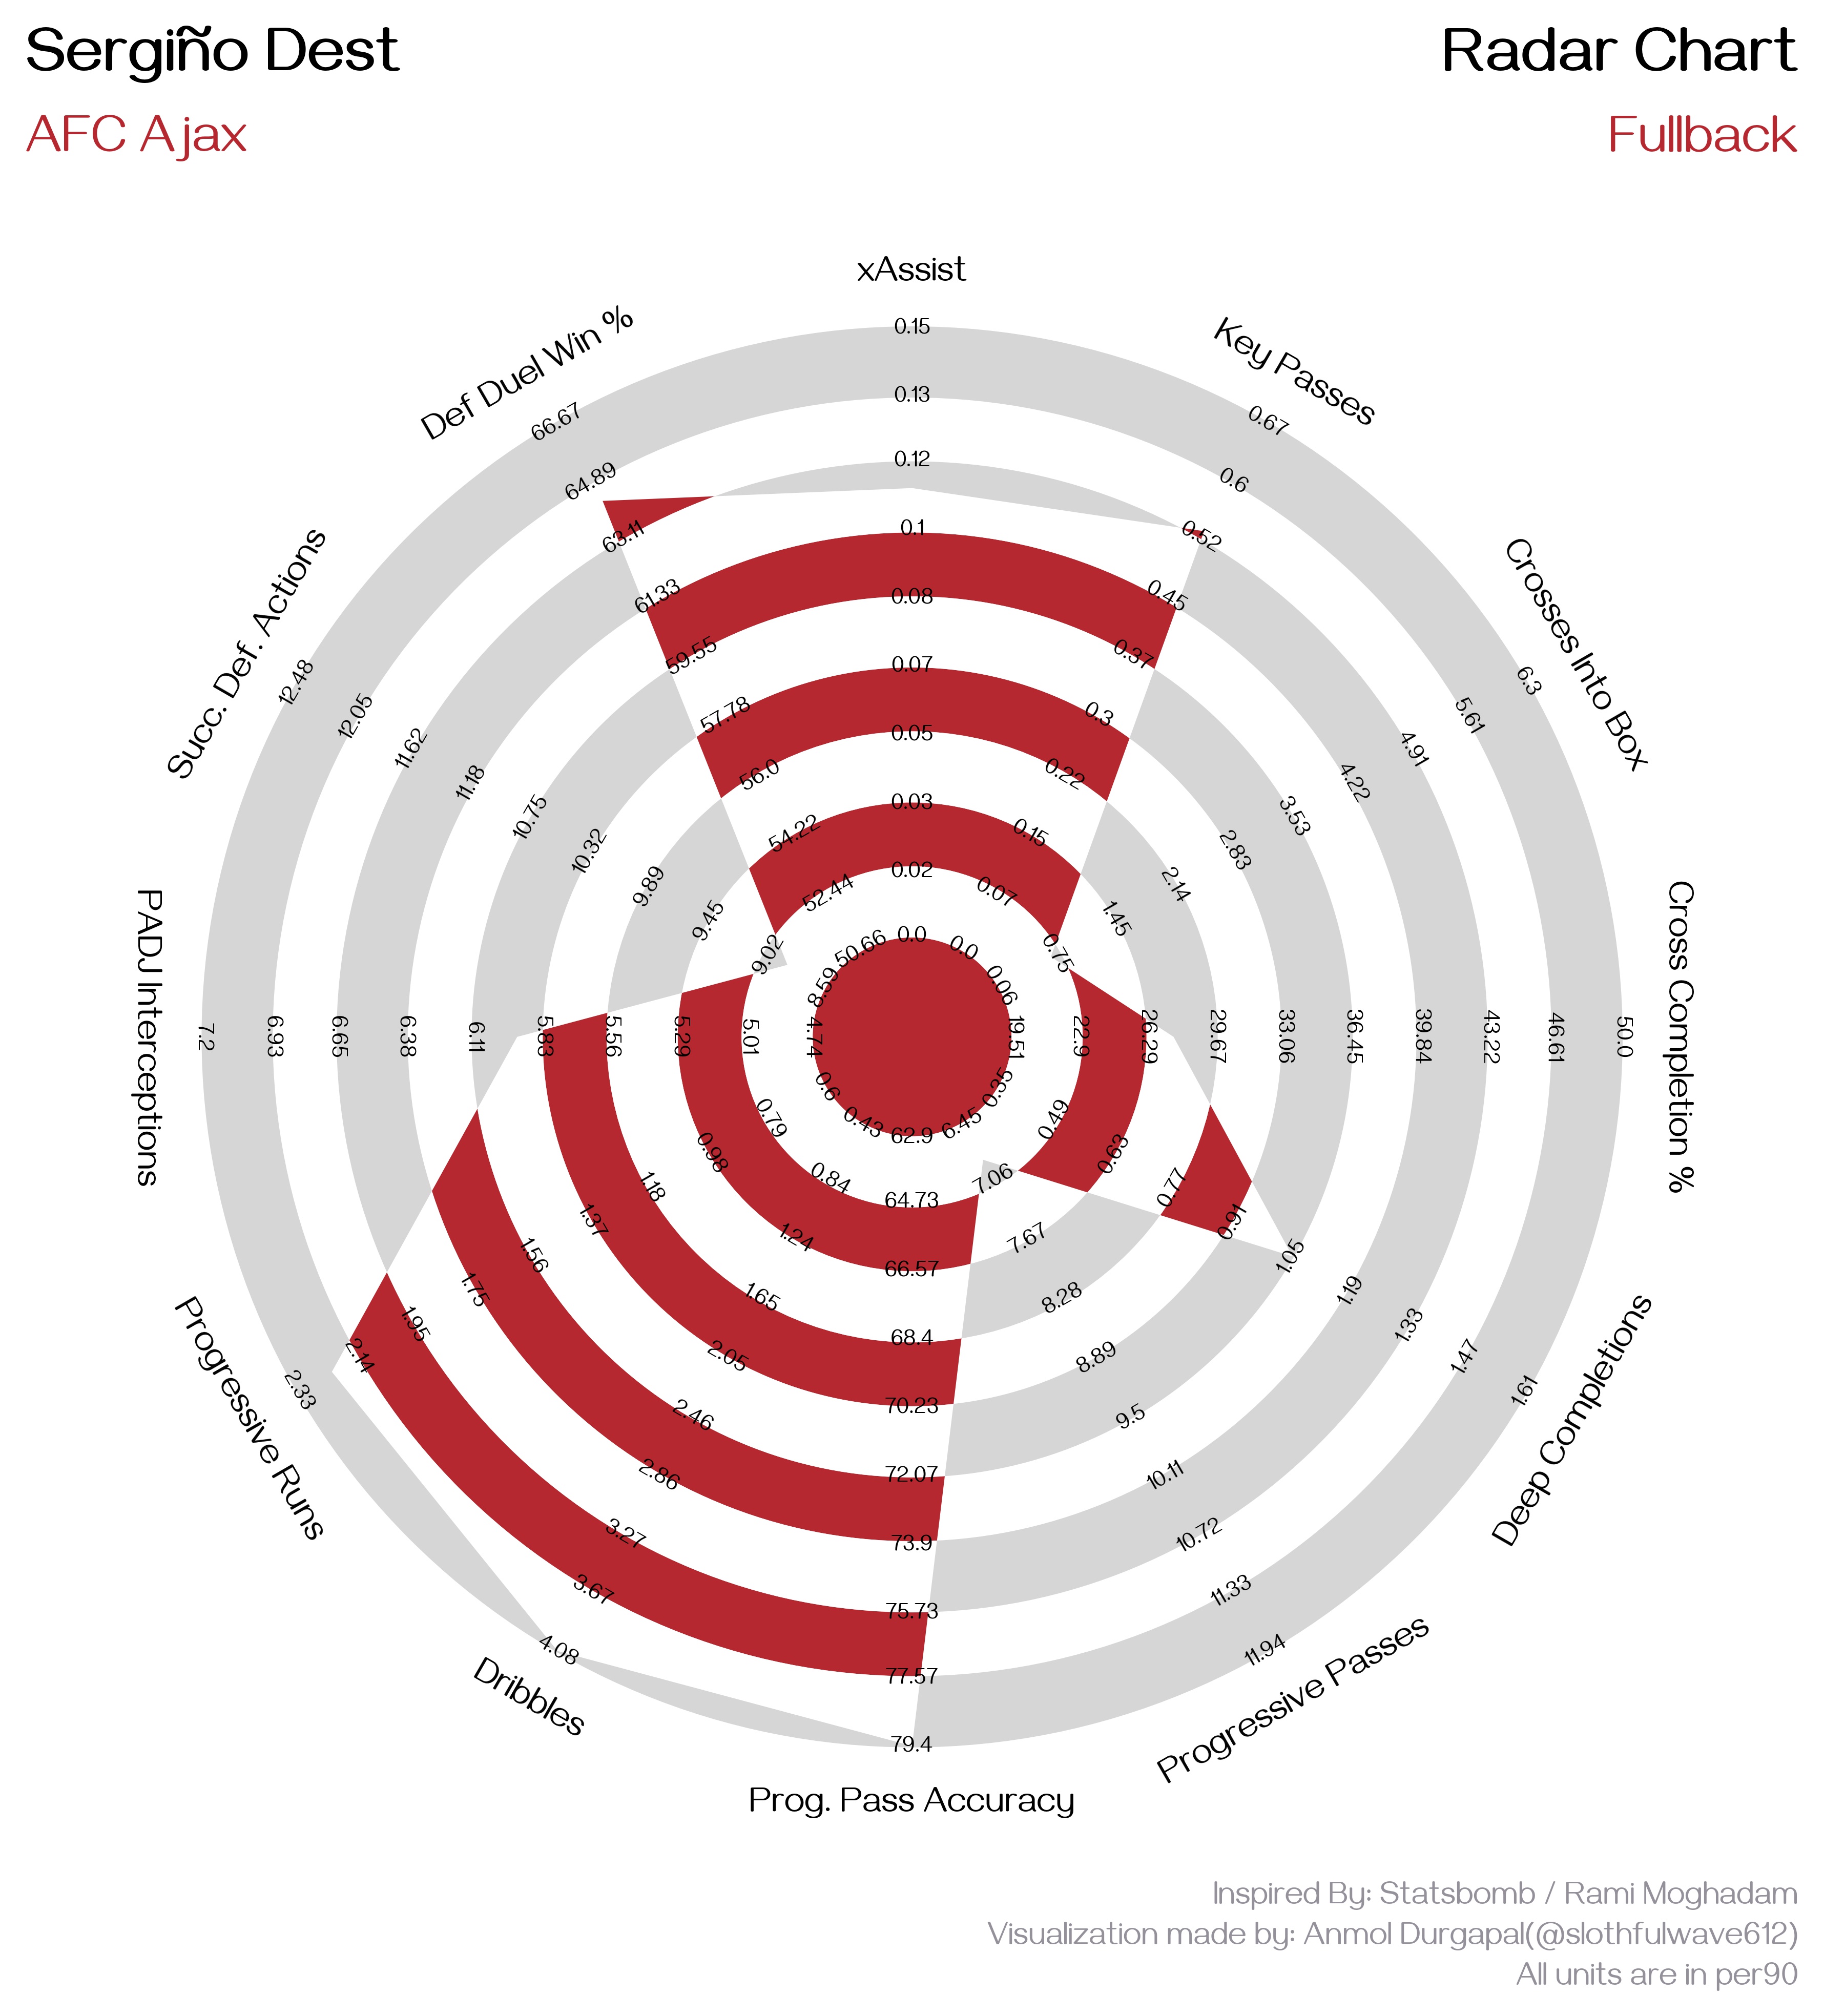
Changing Font
-
Pass
fontfamilyargument toRadarto change the font. -
Code Snippet:
from soccerplots.radar_chart import Radar

## parameter names
params = ['xAssist', 'Key Passes', 'Crosses Into Box', 'Cross Completion %', 'Deep Completions',
          'Progressive Passes', 'Prog. Pass Accuracy', 'Dribbles', 'Progressive Runs',
          'PADJ Interceptions', 'Succ. Def. Actions', 'Def Duel Win %']

## range values
ranges = [(0.0, 0.15), (0.0, 0.67), (0.06, 6.3), (19.51, 50.0), (0.35, 1.61),
          (6.45, 11.94), (62.9, 79.4), (0.43, 4.08), (0.6, 2.33),
          (4.74, 7.2), (8.59, 12.48), (50.66, 66.67)]

## parameter value
values = [0.11, 0.53, 0.70, 27.66, 1.05, 6.84, 84.62, 4.56, 2.22, 5.93, 8.88, 64.29]

## title values
title = dict(
    title_name='Sergiño Dest',
    subtitle_name='AFC Ajax',
    subtitle_color='#B6282F',
    title_name_2='Radar Chart',
    subtitle_name_2='Fullback',
    subtitle_color_2='#B6282F',
    title_fontsize=18,
    subtitle_fontsize=15,
)

## endnote
endnote = "Visualization made by: Anmol Durgapal(@slothfulwave612)\nAll units are in per90"

## instantiate object -- fontfamily
radar = Radar(fontfamily="Gayathri")

## plot radar
fig, ax = radar.plot_radar(ranges=ranges, params=params, values=values,
                           radar_color=['#B6282F', '#FFFFFF'], title=title, endnote=endnote)
- Output:
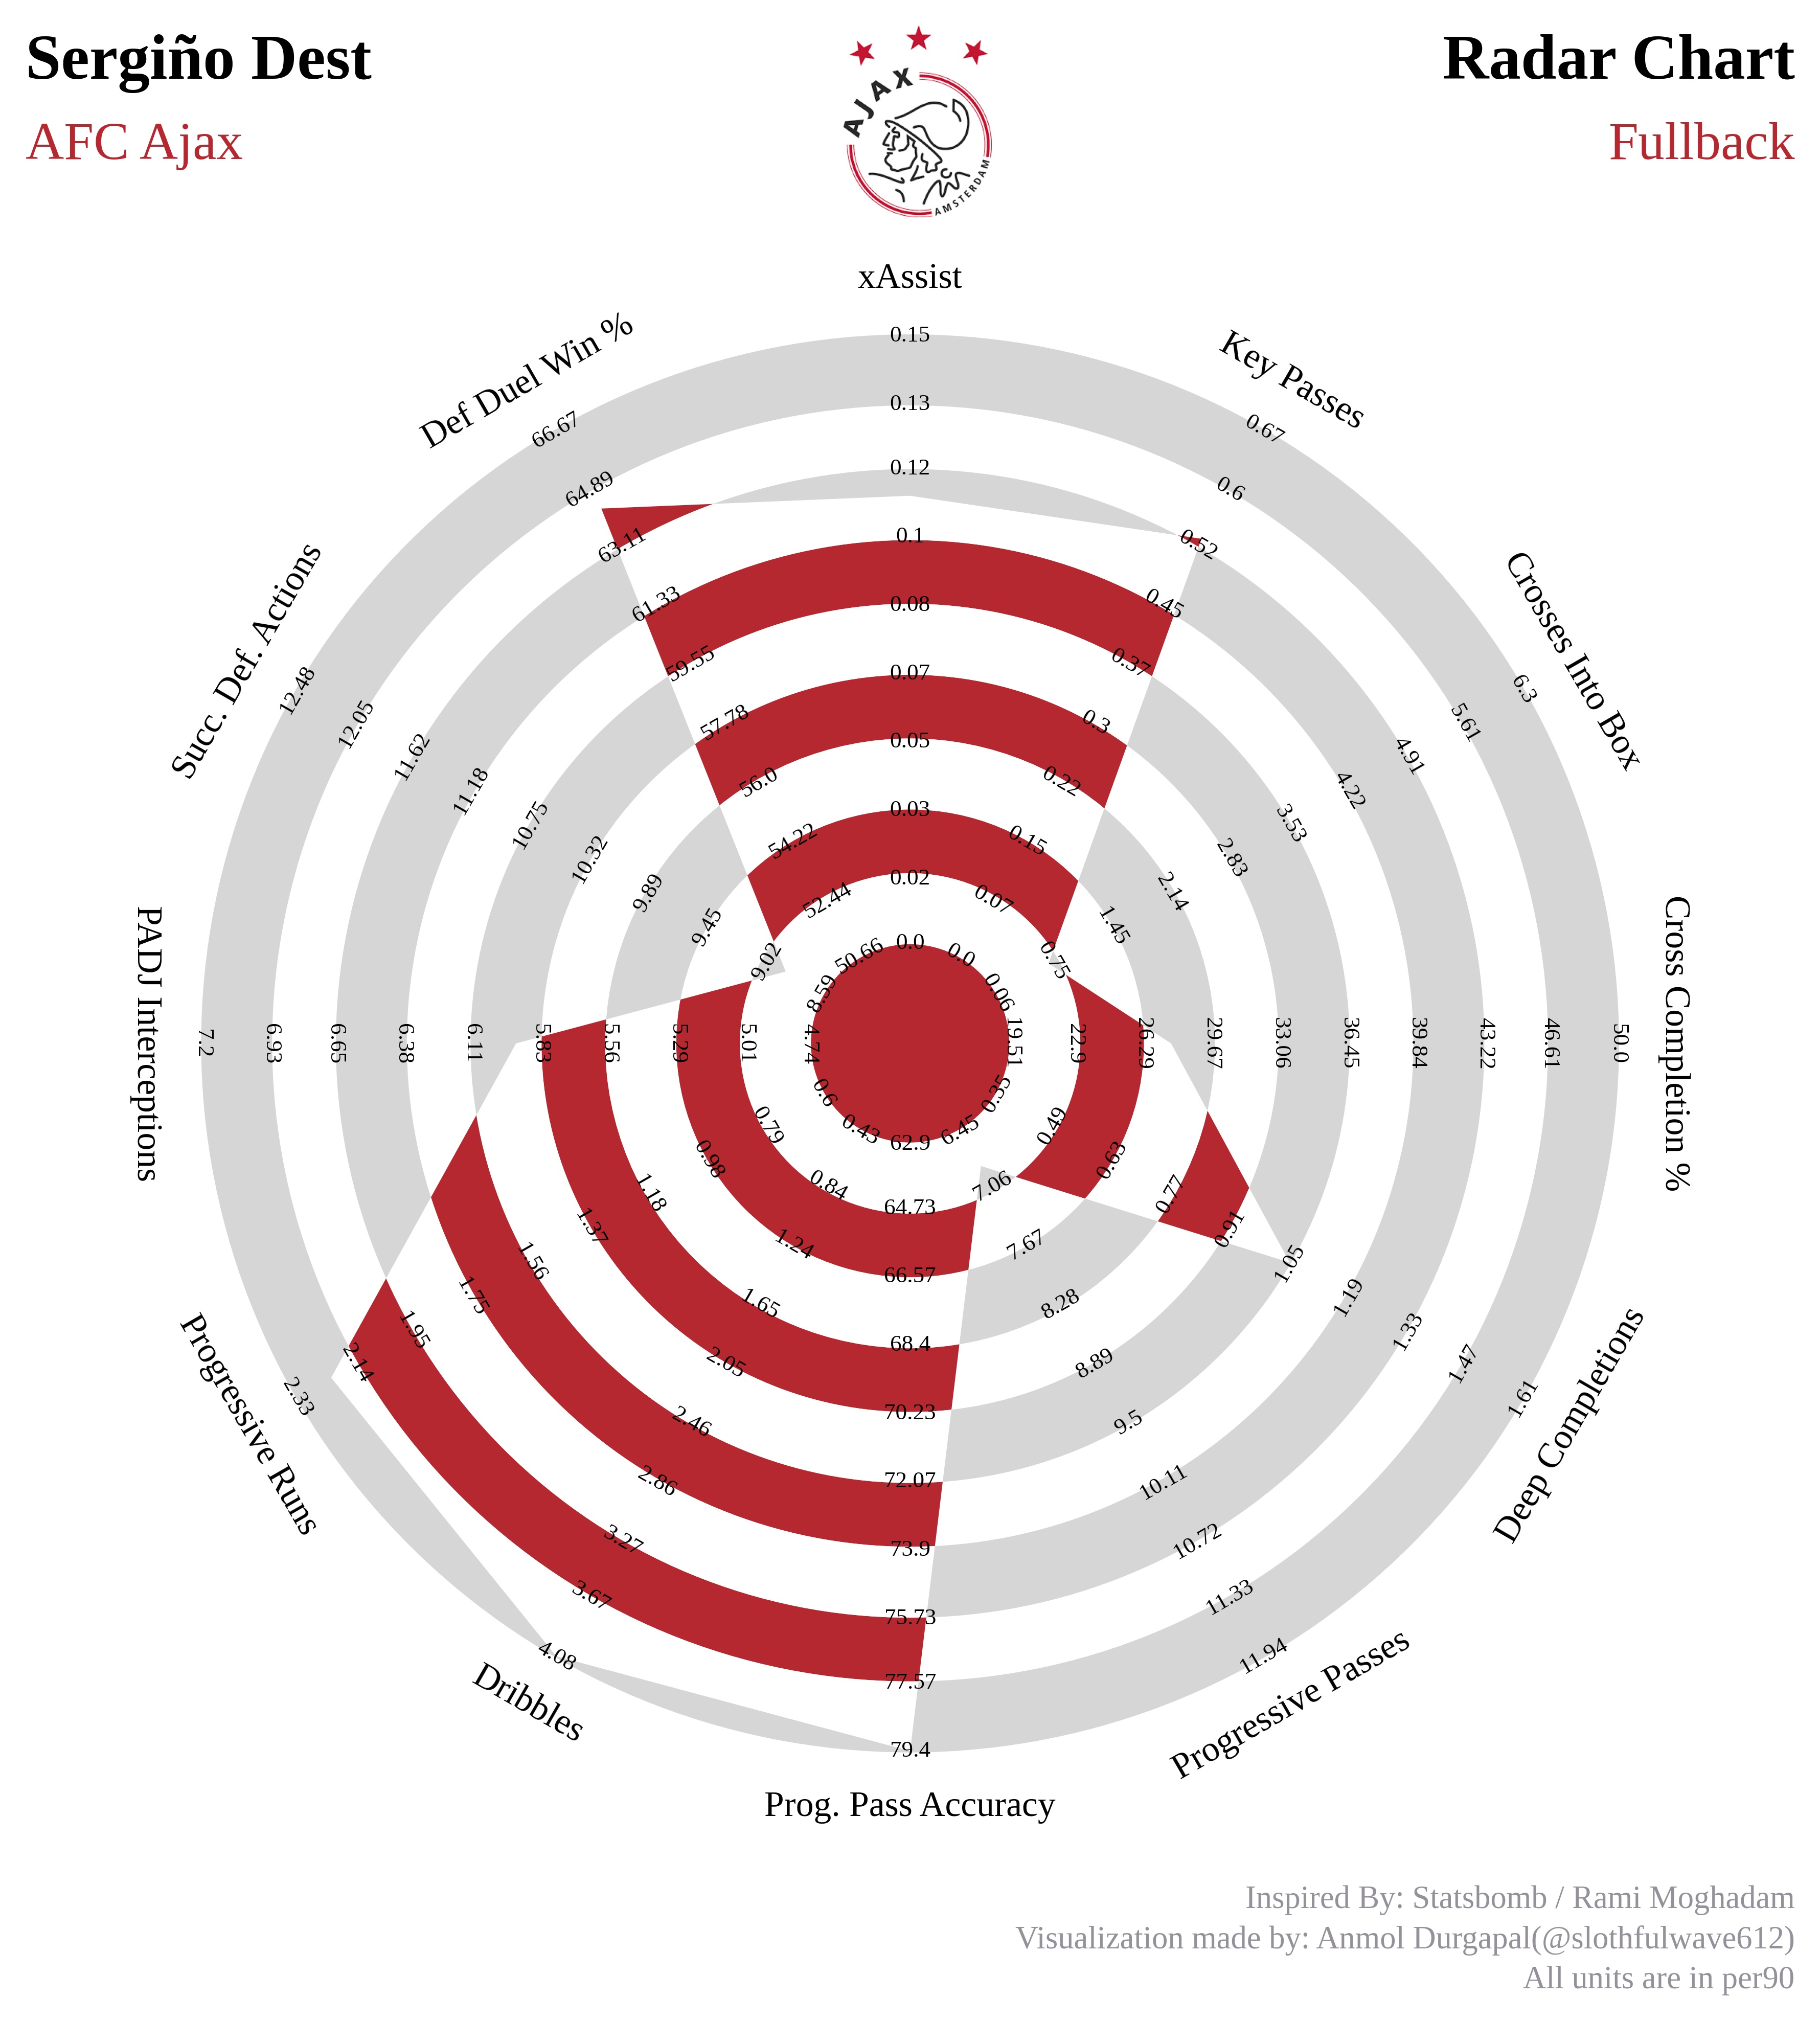
Adding Image
-
We can also add image to our radar chart. Let's see two ways of doing it.
-
We can use
soccerplots.utils.add_imagemethod for adding an image. -
Code Snippet:
from soccerplots.radar_chart import Radar
from soccerplots.utils import add_image

## parameter names
params = ['xAssist', 'Key Passes', 'Crosses Into Box', 'Cross Completion %', 'Deep Completions',
          'Progressive Passes', 'Prog. Pass Accuracy', 'Dribbles', 'Progressive Runs',
          'PADJ Interceptions', 'Succ. Def. Actions', 'Def Duel Win %']

## range values
ranges = [(0.0, 0.15), (0.0, 0.67), (0.06, 6.3), (19.51, 50.0), (0.35, 1.61),
          (6.45, 11.94), (62.9, 79.4), (0.43, 4.08), (0.6, 2.33),
          (4.74, 7.2), (8.59, 12.48), (50.66, 66.67)]

## parameter value
values = [0.11, 0.53, 0.70, 27.66, 1.05, 6.84, 84.62, 4.56, 2.22, 5.93, 8.88, 64.29]

## title values
title = dict(
    title_name='Sergiño Dest',
    subtitle_name='AFC Ajax',
    subtitle_color='#B6282F',
    title_name_2='Radar Chart',
    subtitle_name_2='Fullback',
    subtitle_color_2='#B6282F',
    title_fontsize=18,
    subtitle_fontsize=15,
)

## endnote
endnote = "Visualization made by: Anmol Durgapal(@slothfulwave612)\nAll units are in per90"

## instantiate object
radar = Radar()

## plot radar
fig, ax = radar.plot_radar(ranges=ranges, params=params, values=values,
                           radar_color=['#B6282F', '#FFFFFF'], title=title,
                           endnote=endnote)

## add image -- http://bit.do/ajax_img
fig = add_image(image="ajax.png", fig=fig, left=0.464, bottom=0.81, width=0.1, height=0.075)
- Output:
-
An alternative way is to pass
imageandimg_coordargument toplot_radarmethod. -
Code Snippet:
from soccerplots.radar_chart import Radar

## parameter names
params = ['xAssist', 'Key Passes', 'Crosses Into Box', 'Cross Completion %', 'Deep Completions',
          'Progressive Passes', 'Prog. Pass Accuracy', 'Dribbles', 'Progressive Runs',
          'PADJ Interceptions', 'Succ. Def. Actions', 'Def Duel Win %']

## range values
ranges = [(0.0, 0.15), (0.0, 0.67), (0.06, 6.3), (19.51, 50.0), (0.35, 1.61),
          (6.45, 11.94), (62.9, 79.4), (0.43, 4.08), (0.6, 2.33),
          (4.74, 7.2), (8.59, 12.48), (50.66, 66.67)]

## parameter value
values = [0.11, 0.53, 0.70, 27.66, 1.05, 6.84, 84.62, 4.56, 2.22, 5.93, 8.88, 64.29]

## title values
title = dict(
    title_name='Sergiño Dest',
    subtitle_name='AFC Ajax',
    subtitle_color='#B6282F',
    title_name_2='Radar Chart',
    subtitle_name_2='Fullback',
    subtitle_color_2='#B6282F',
    title_fontsize=18,
    subtitle_fontsize=15,
)

## endnote
endnote = "Visualization made by: Anmol Durgapal(@slothfulwave612)\nAll units are in per90"

## instantiate object
radar = Radar()

## plot radar -- image link: http://bit.do/ajax_img
fig, ax = radar.plot_radar(ranges=ranges, params=params, values=values,
                           radar_color=['#B6282F', '#FFFFFF'], title=title,
                           image='ajax.png', image_coord=[0.464, 0.81, 0.1, 0.075],
                           endnote=endnote)
- Output:

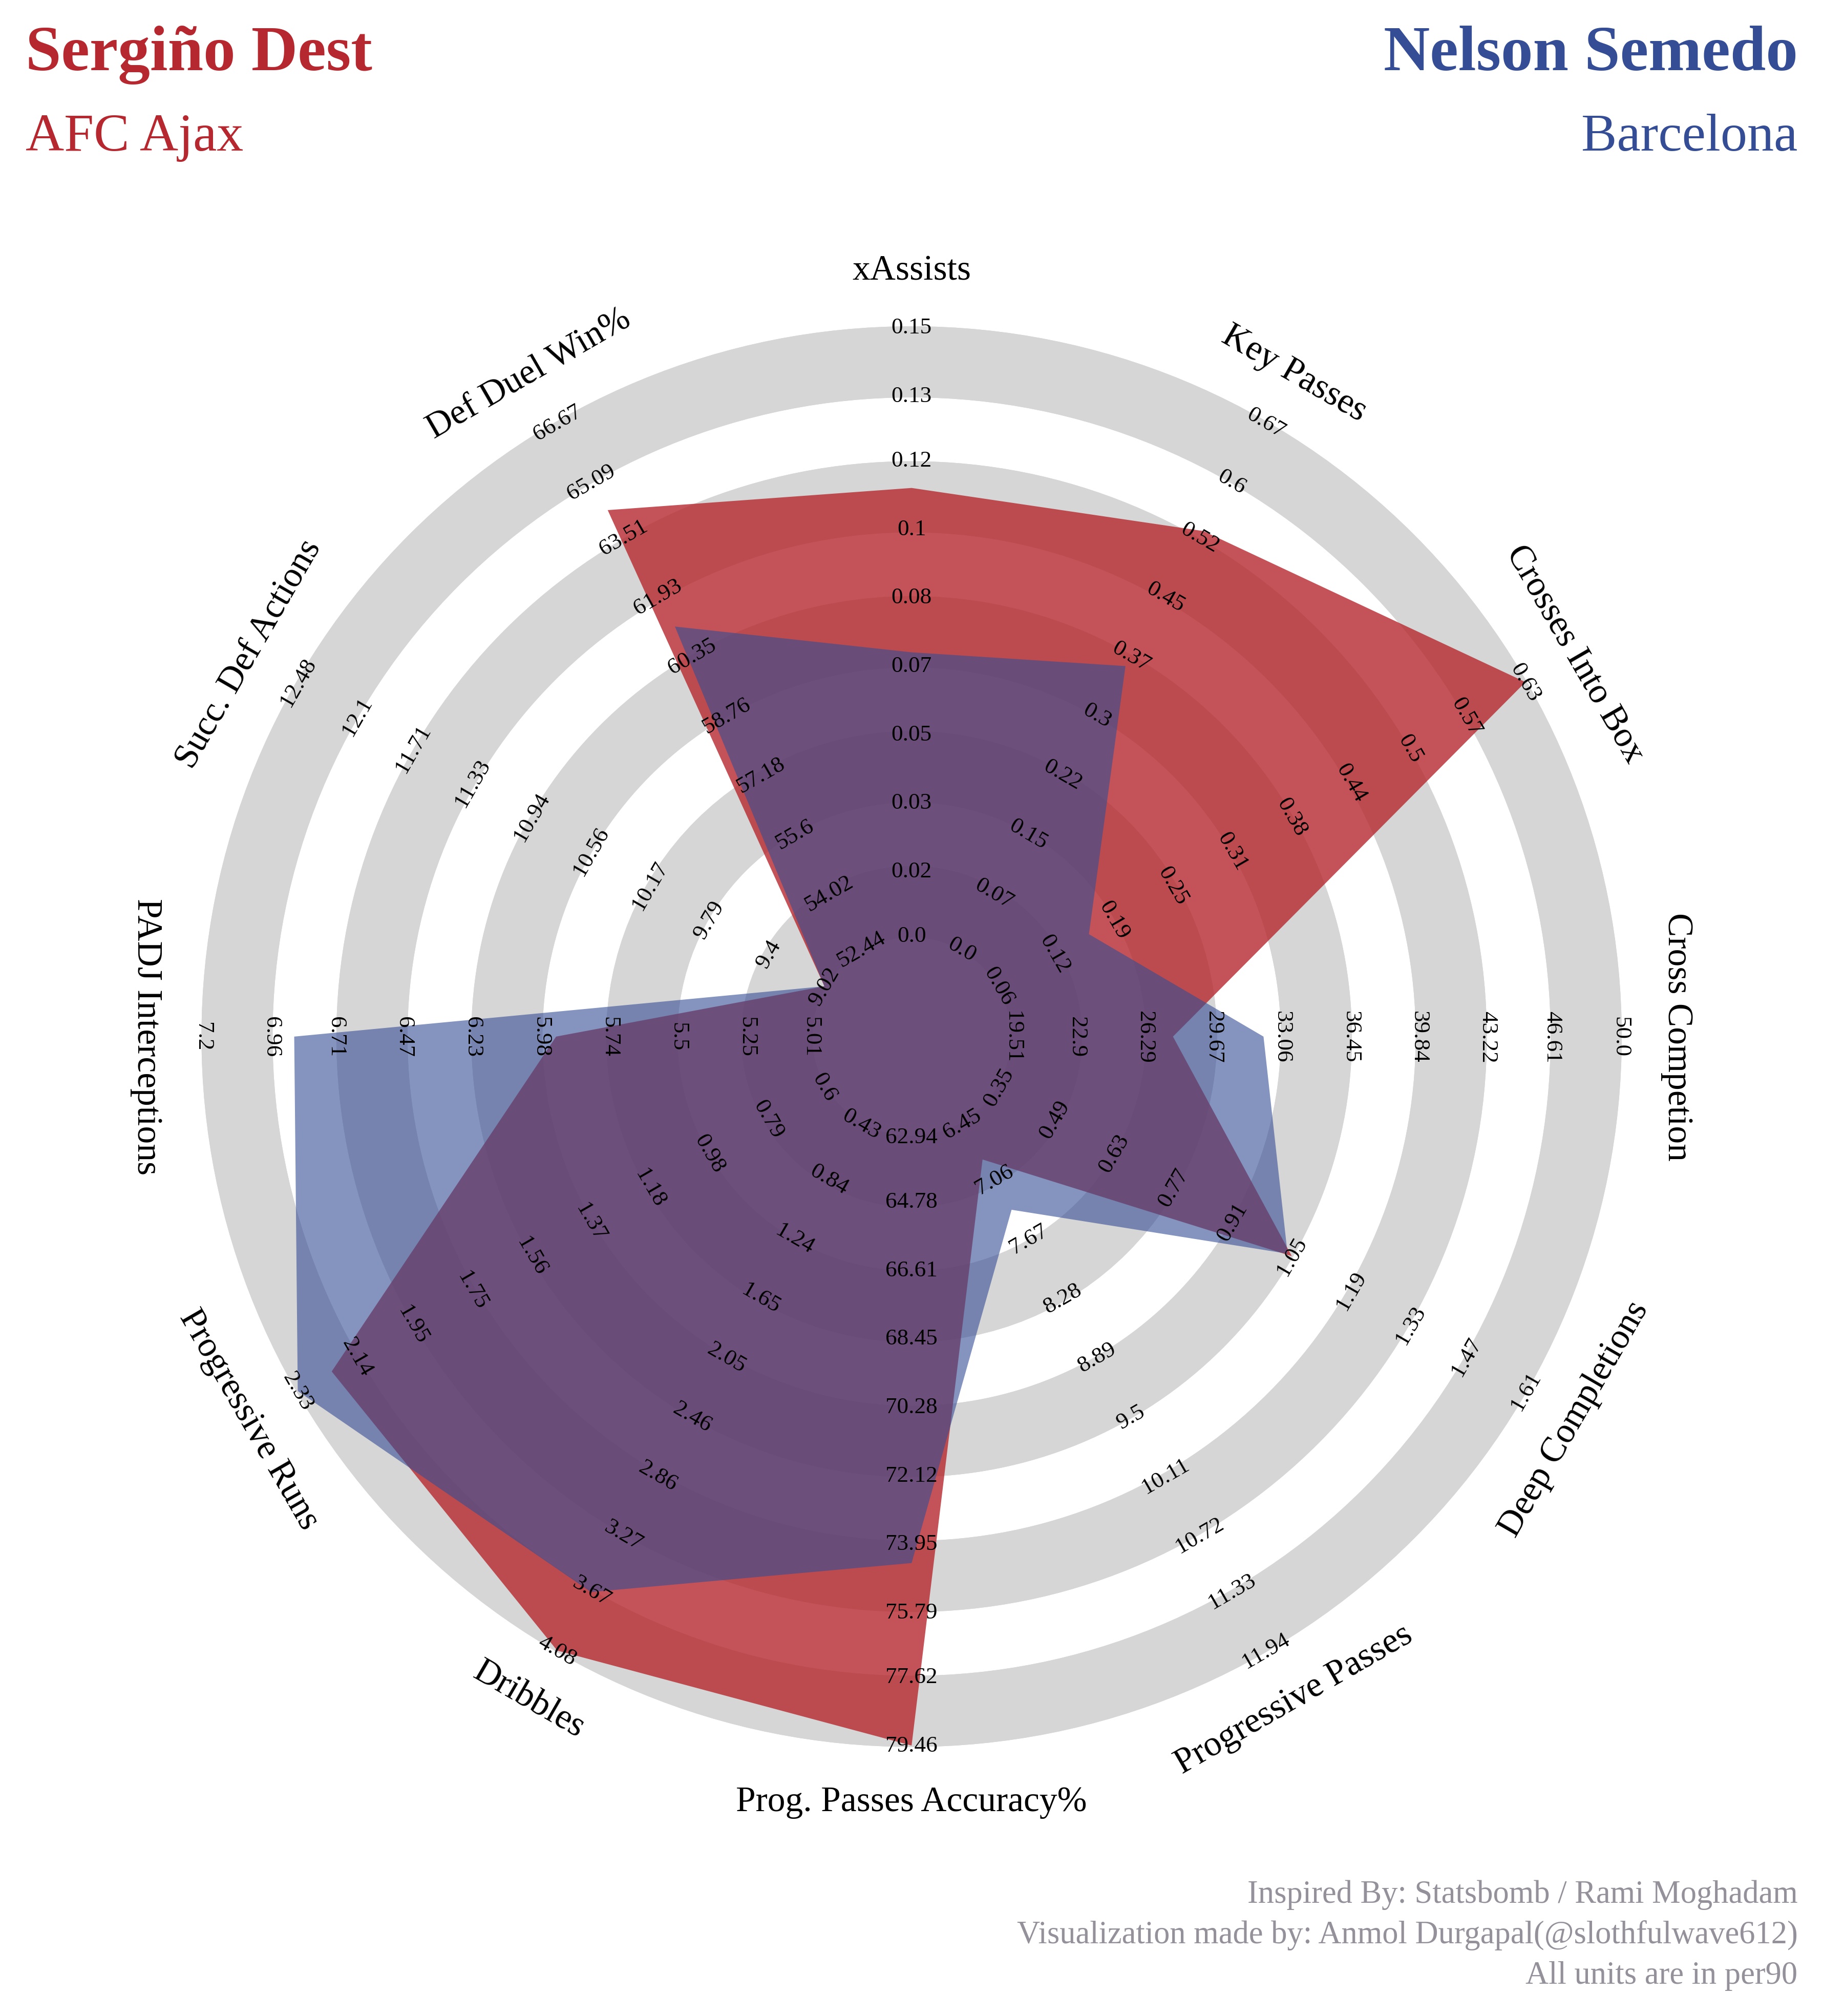
Making comparison radar chart
-
We can use
soccerplotsto make comparison chart as well. -
Here is how one can do it.
-
Code Snippet:
from soccerplots.radar_chart import Radar

## parameter names
params = ['xAssists', 'Key Passes', 'Crosses Into Box', 'Cross Competion', 'Deep Completions',
          'Progressive Passes', 'Prog. Passes Accuracy%', 'Dribbles', 'Progressive Runs',
          'PADJ Interceptions', 'Succ. Def Actions', 'Def Duel Win%']

## range values
ranges = [(0.0, 0.15), (0.0, 0.67), (0.06, 0.63), (19.51, 50.0), (0.35, 1.61), (6.45, 11.94), (62.94, 79.46), (0.43, 4.08), (0.6, 2.33), (5.01, 7.2), (9.02, 12.48),
          (52.44, 66.67)]

## parameter value
values = [
    [0.11, 0.53, 0.70, 27.66, 1.05, 6.84, 84.62, 4.56, 2.22, 5.93, 8.88, 64.29],   ## for Sergino Dest
    [0.07, 0.36, 0.16, 32.14, 1.04, 7.37, 74.46, 3.68, 2.40, 6.87, 8.97, 61.14]    ## for Nelson Semedo
]

## title
title = dict(
    title_name='Sergiño Dest',
    title_color='#B6282F',
    subtitle_name='AFC Ajax',
    subtitle_color='#B6282F',
    title_name_2='Nelson Semedo',
    title_color_2='#344D94',
    subtitle_name_2='Barcelona',
    subtitle_color_2='#344D94',
    title_fontsize=18,
    subtitle_fontsize=15,
)

## endnote
endnote = "Visualization made by: Anmol Durgapal(@slothfulwave612)\nAll units are in per90"

## instantiate object
radar = Radar()

## plot radar -- compare
fig, ax = radar.plot_radar(ranges=ranges, params=params, values=values,
                           radar_color=['#B6282F', '#344D94'],
                           title=title, endnote=endnote,
                           compare=True)
- Output:

Changing alpha values for comparison radar
-
We can also change the alpha value to shade dark/light the polygon covering the area in the radar-chart.
-
One can pass
alphaswhich is a list of alpha values to obtain required changes. -
Code Snippet:
from soccerplots.radar_chart import Radar

## parameter names
params = ['xAssists', 'Key Passes', 'Crosses Into Box', 'Cross Competion', 'Deep Completions',
          'Progressive Passes', 'Prog. Passes Accuracy%', 'Dribbles', 'Progressive Runs',
          'PADJ Interceptions', 'Succ. Def Actions', 'Def Duel Win%']

## range values
ranges = [(0.0, 0.15), (0.0, 0.67), (0.06, 0.63), (19.51, 50.0), (0.35, 1.61), (6.45, 11.94), (62.94, 79.46), (0.43, 4.08), (0.6, 2.33), (5.01, 7.2), (9.02, 12.48),
          (52.44, 66.67)]

## parameter value
values = [
    [0.11, 0.53, 0.70, 27.66, 1.05, 6.84, 84.62, 4.56, 2.22, 5.93, 8.88, 64.29],   ## for Sergino Dest
    [0.07, 0.36, 0.16, 32.14, 1.04, 7.37, 74.46, 3.68, 2.40, 6.87, 8.97, 61.14]    ## for Nelson Semedo
]

## title
title = dict(
    title_name='Sergiño Dest',
    title_color='#B6282F',
    subtitle_name='AFC Ajax',
    subtitle_color='#B6282F',
    title_name_2='Nelson Semedo',
    title_color_2='#344D94',
    subtitle_name_2='Barcelona',
    subtitle_color_2='#344D94',
    title_fontsize=18,
    subtitle_fontsize=15,
)

## endnote
endnote = "Visualization made by: Anmol Durgapal(@slothfulwave612)\nAll units are in per90"

## instantiate object
radar = Radar()

## plot radar -- alphas
fig, ax = radar.plot_radar(ranges=ranges, params=params, values=values,
                                 radar_color=['#B6282F', '#344D94'],
                                 alphas=[0.8, 0.6], title=title, endnote=endnote,
                                 compare=True)
- Output:
Passing fig, ax
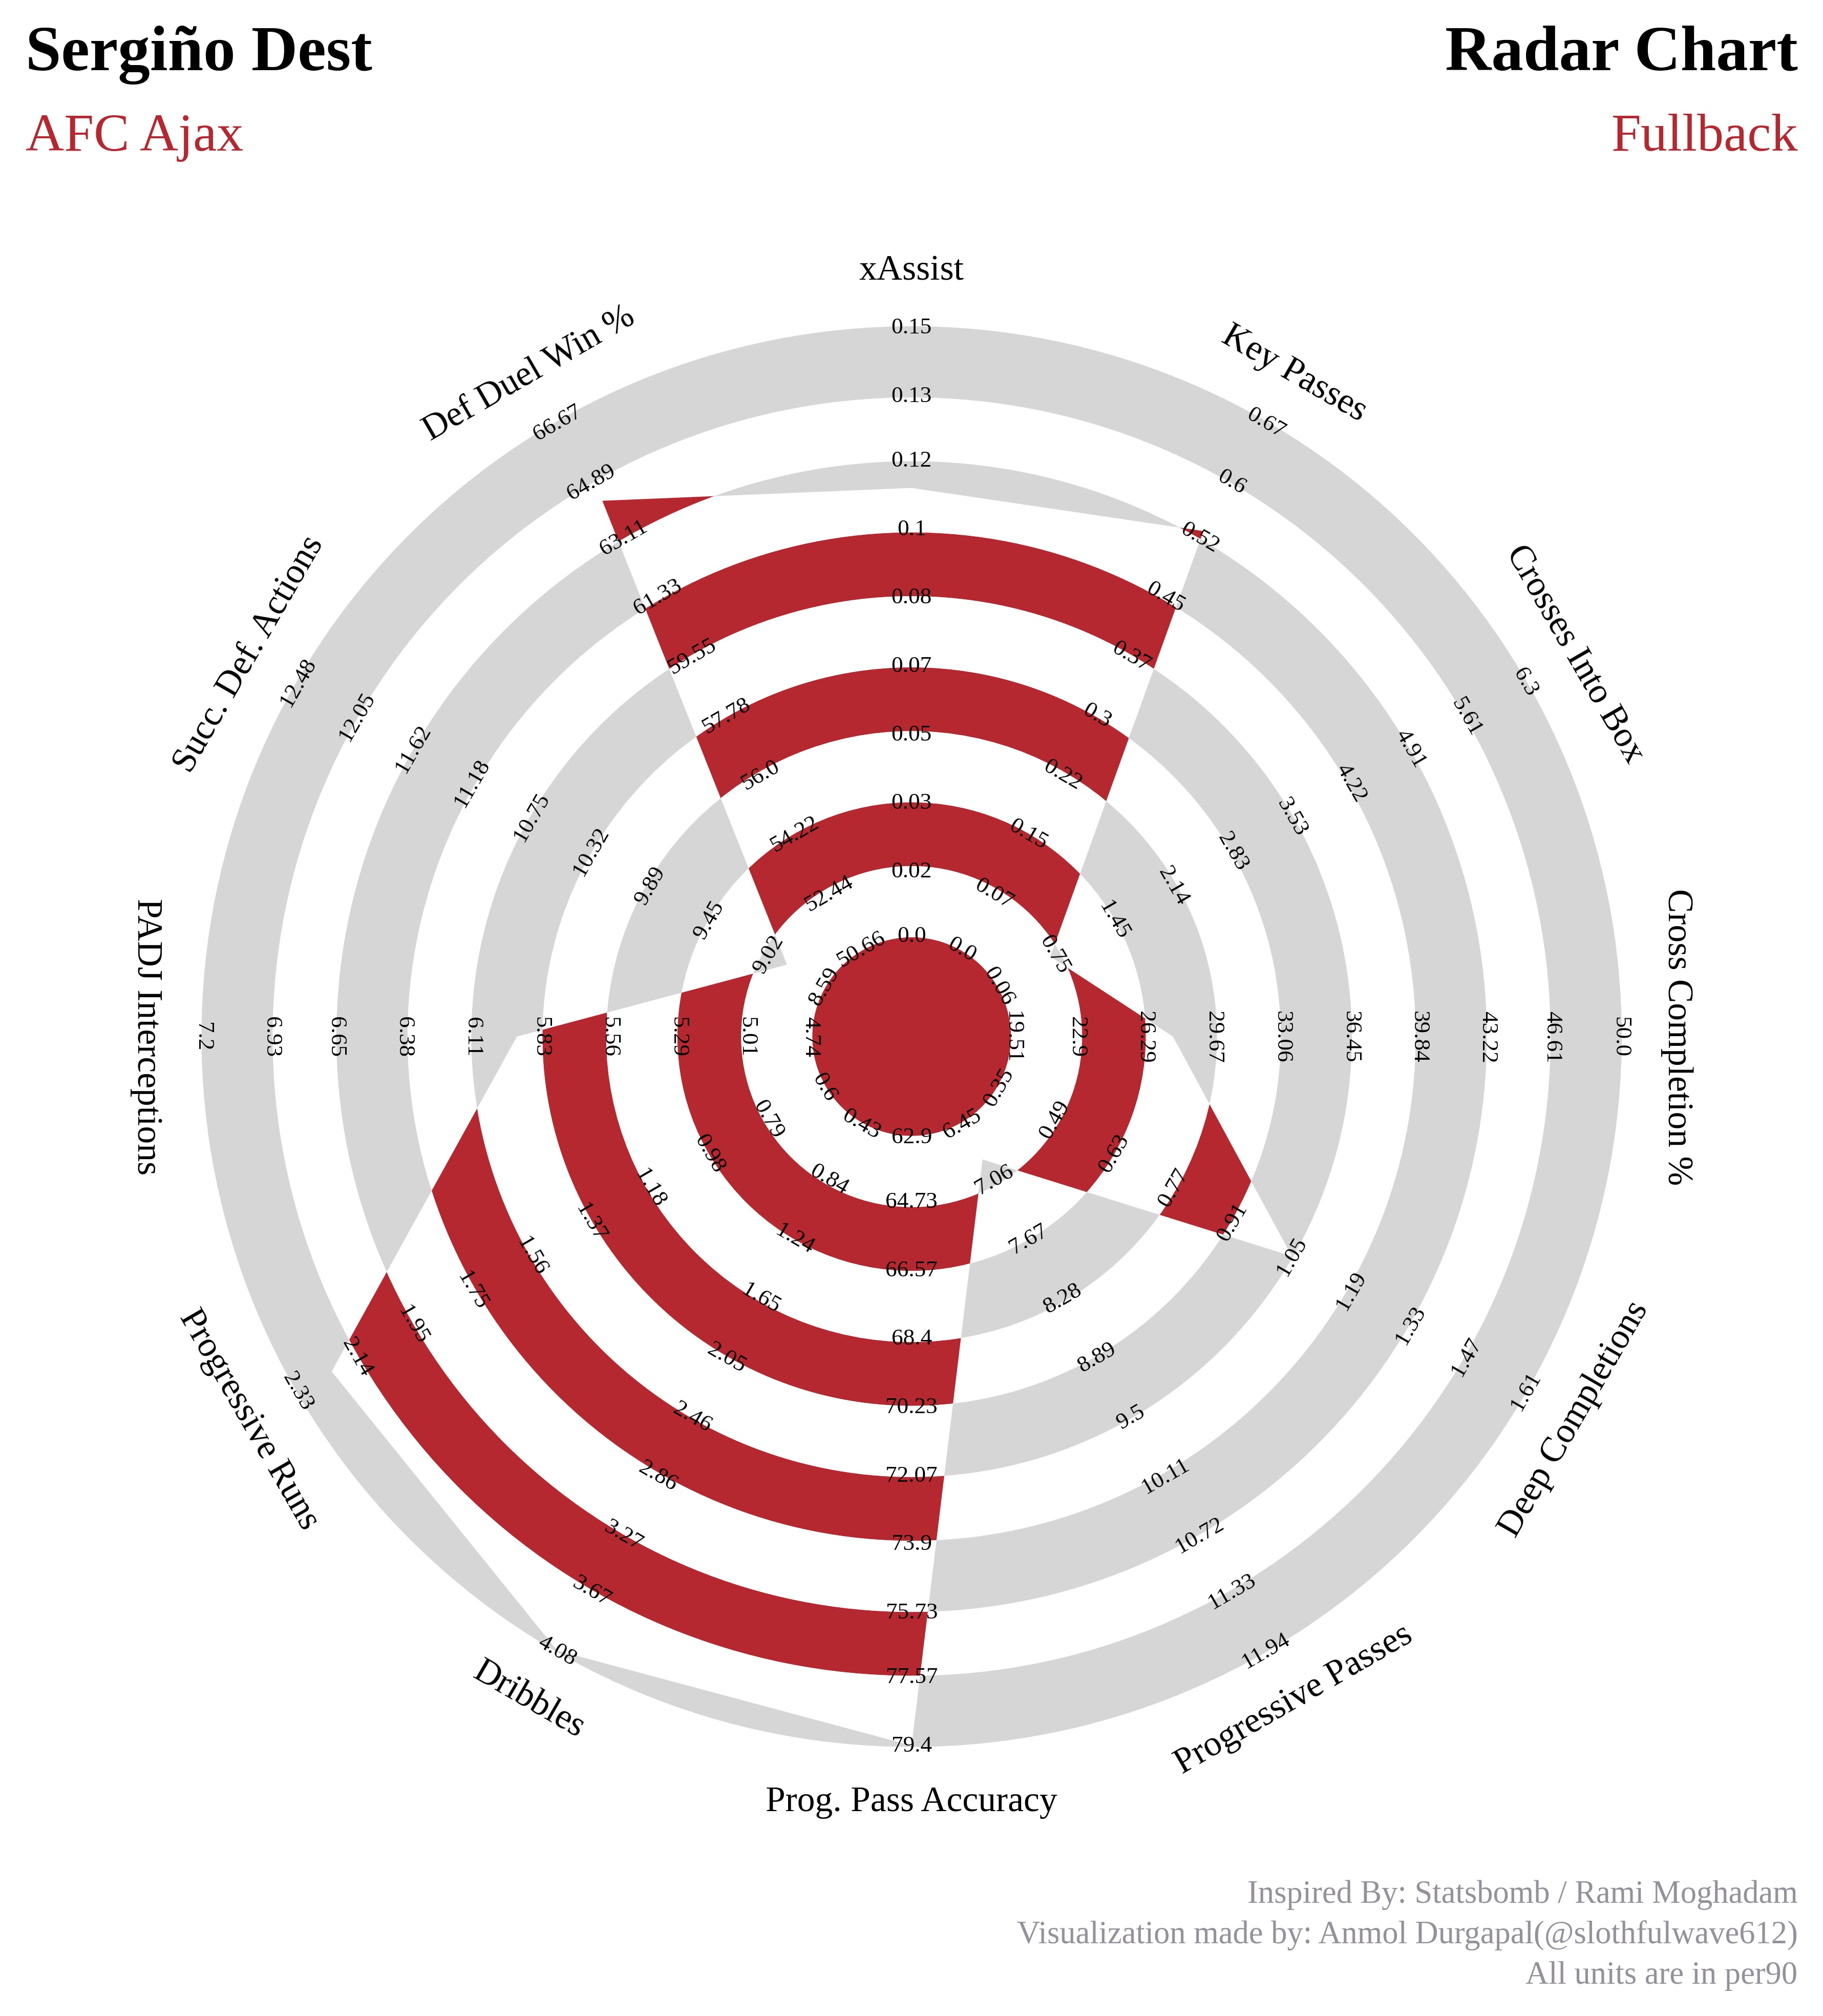
-
If the user has it's own defined
figureandaxisobject, can pass it tofigaxargument inplot_radarmethod to plot radar in definedfigureandaxisobject. -
Code Snippet:
import matplotlib.pyplot as plt
from soccerplots.radar_chart import Radar

## parameter names
params = ['xAssist', 'Key Passes', 'Crosses Into Box', 'Cross Completion %', 'Deep Completions',
          'Progressive Passes', 'Prog. Pass Accuracy', 'Dribbles', 'Progressive Runs',
          'PADJ Interceptions', 'Succ. Def. Actions', 'Def Duel Win %']

## range values
ranges = [(0.0, 0.15), (0.0, 0.67), (0.06, 6.3), (19.51, 50.0), (0.35, 1.61),
          (6.45, 11.94), (62.9, 79.4), (0.43, 4.08), (0.6, 2.33),
          (4.74, 7.2), (8.59, 12.48), (50.66, 66.67)]

## parameter value
values = [0.11, 0.53, 0.70, 27.66, 1.05, 6.84, 84.62, 4.56, 2.22, 5.93, 8.88, 64.29]

## title values
title = dict(
    title_name='Sergiño Dest',
    subtitle_name='AFC Ajax',
    subtitle_color='#B6282F',
    title_name_2='Radar Chart',
    subtitle_name_2='Fullback',
    subtitle_color_2='#B6282F',
    title_fontsize=18,
    subtitle_fontsize=15,
)

## endnote
endnote = "Visualization made by: Anmol Durgapal(@slothfulwave612)\nAll units are in per90"

## make a subplot
fig, ax = plt.subplots(figsize=(20, 10))

## instantiate object
radar = Radar()

## plot radar -- figax
fig, ax = radar.plot_radar(ranges=ranges, params=params,
                           values=values, radar_color=['#B6282F', '#FFFFFF'],
                           title=title, endnote=endnote, figax=(fig,ax))
- Output:
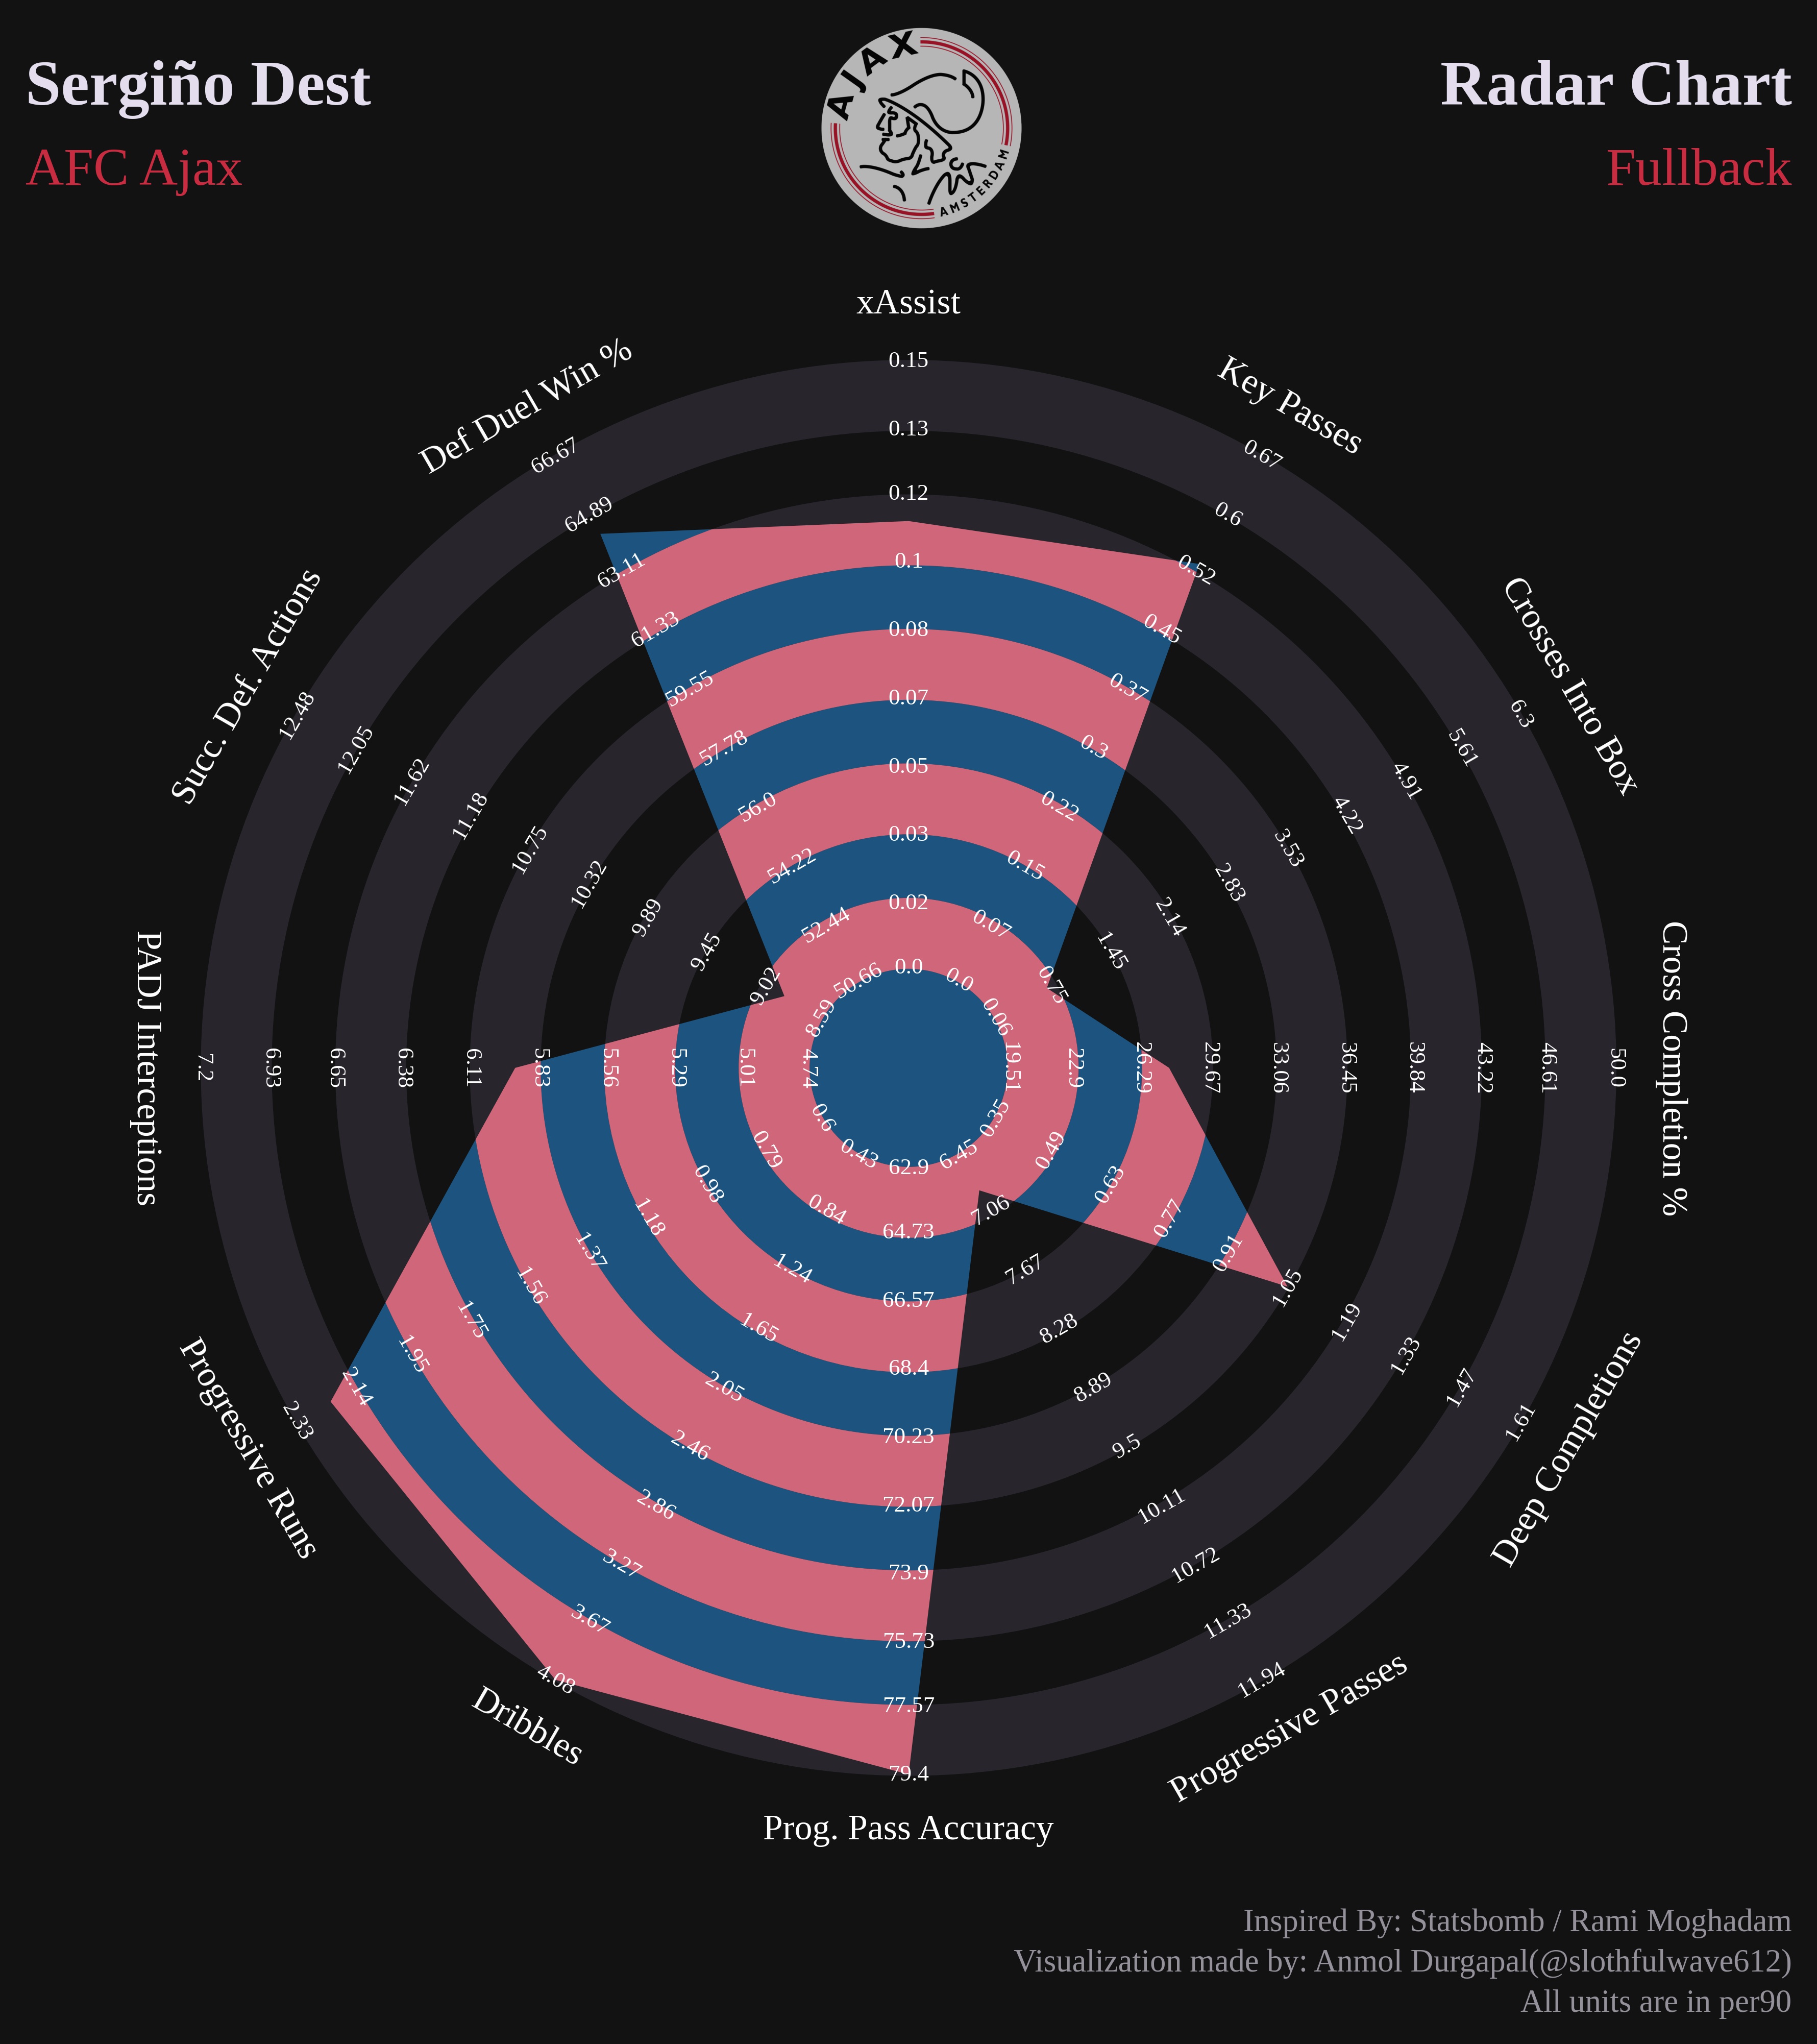
Dark Theme Template
-
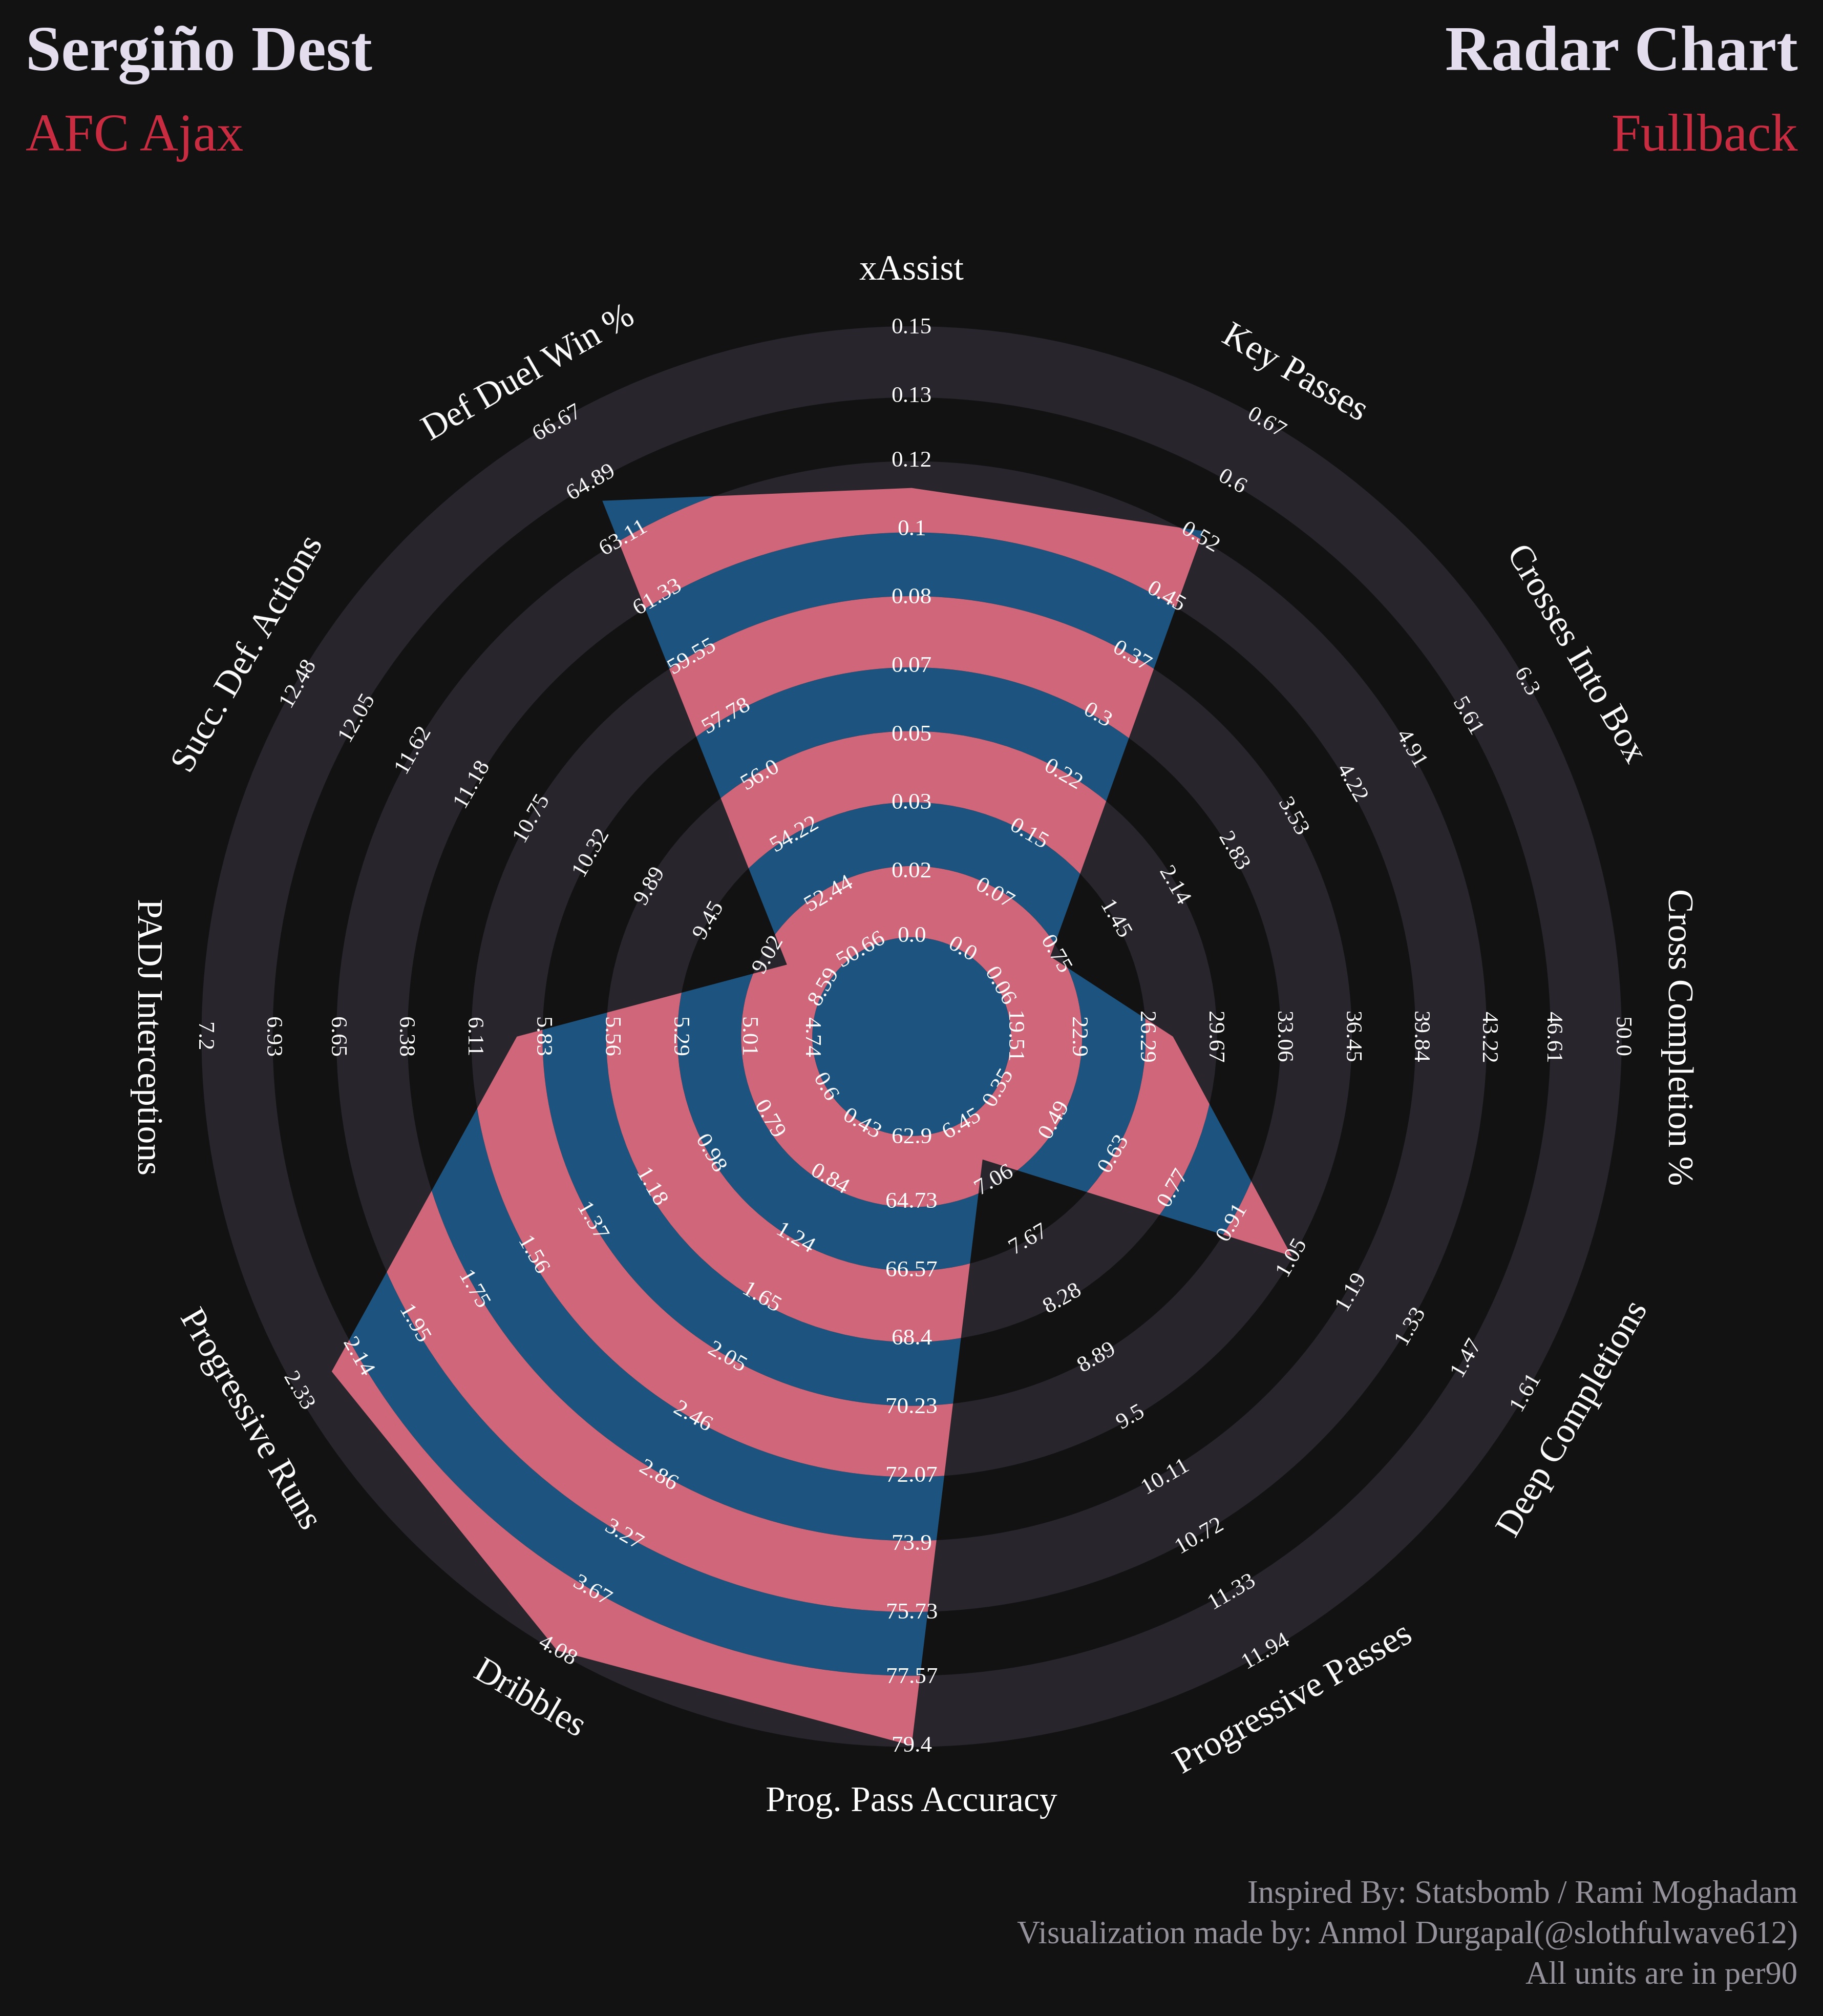
With the newest update of
soccerplotspackage one can plot radar chart, with his/her own defined theme, i.e. can now change the background, label and range colors as well. -
Here I will demonstrate how to make dark mode radar charts using
soccerplots. -
Contents:
Dark Theme
-
The user can update the colors by passing
background_color,patch_color,label_colorandrange_colorargument to theRadar. -
Code Snippet:
from soccerplots.radar_chart import Radar

## parameter names
params = ['xAssist', 'Key Passes', 'Crosses Into Box', 'Cross Completion %', 'Deep Completions',
          'Progressive Passes', 'Prog. Pass Accuracy', 'Dribbles', 'Progressive Runs',
          'PADJ Interceptions', 'Succ. Def. Actions', 'Def Duel Win %']

## range values
ranges = [(0.0, 0.15), (0.0, 0.67), (0.06, 6.3), (19.51, 50.0), (0.35, 1.61),
          (6.45, 11.94), (62.9, 79.4), (0.43, 4.08), (0.6, 2.33),
          (4.74, 7.2), (8.59, 12.48), (50.66, 66.67)]

## parameter value
values = [0.11, 0.53, 0.70, 27.66, 1.05, 6.84, 84.62, 4.56, 2.22, 5.93, 8.88, 64.29]

## title values
title = dict(
    title_name="Sergiño Dest",
    title_color="#E3DDED",
    subtitle_name="AFC Ajax",
    subtitle_color="#C72C41",
    title_name_2="Radar Chart",
    title_color_2="#E3DDED",
    subtitle_name_2='Fullback',
    subtitle_color_2='#C72C41',
    title_fontsize=18,
    subtitle_fontsize=15
)

## endnote
endnote = "Visualization made by: Anmol Durgapal(@slothfulwave612)\nAll units are in per90"

## instantiate object
radar = Radar(background_color="#121212", patch_color="#28252C", label_color="#FFFFFF",
              range_color="#FFFFFF")

## plot radar
fig, ax = radar.plot_radar(ranges=ranges, params=params,
                           values=values, radar_color=['#1c547f', '#CF6679'],
                           title=title, endnote=endnote)
- Output:
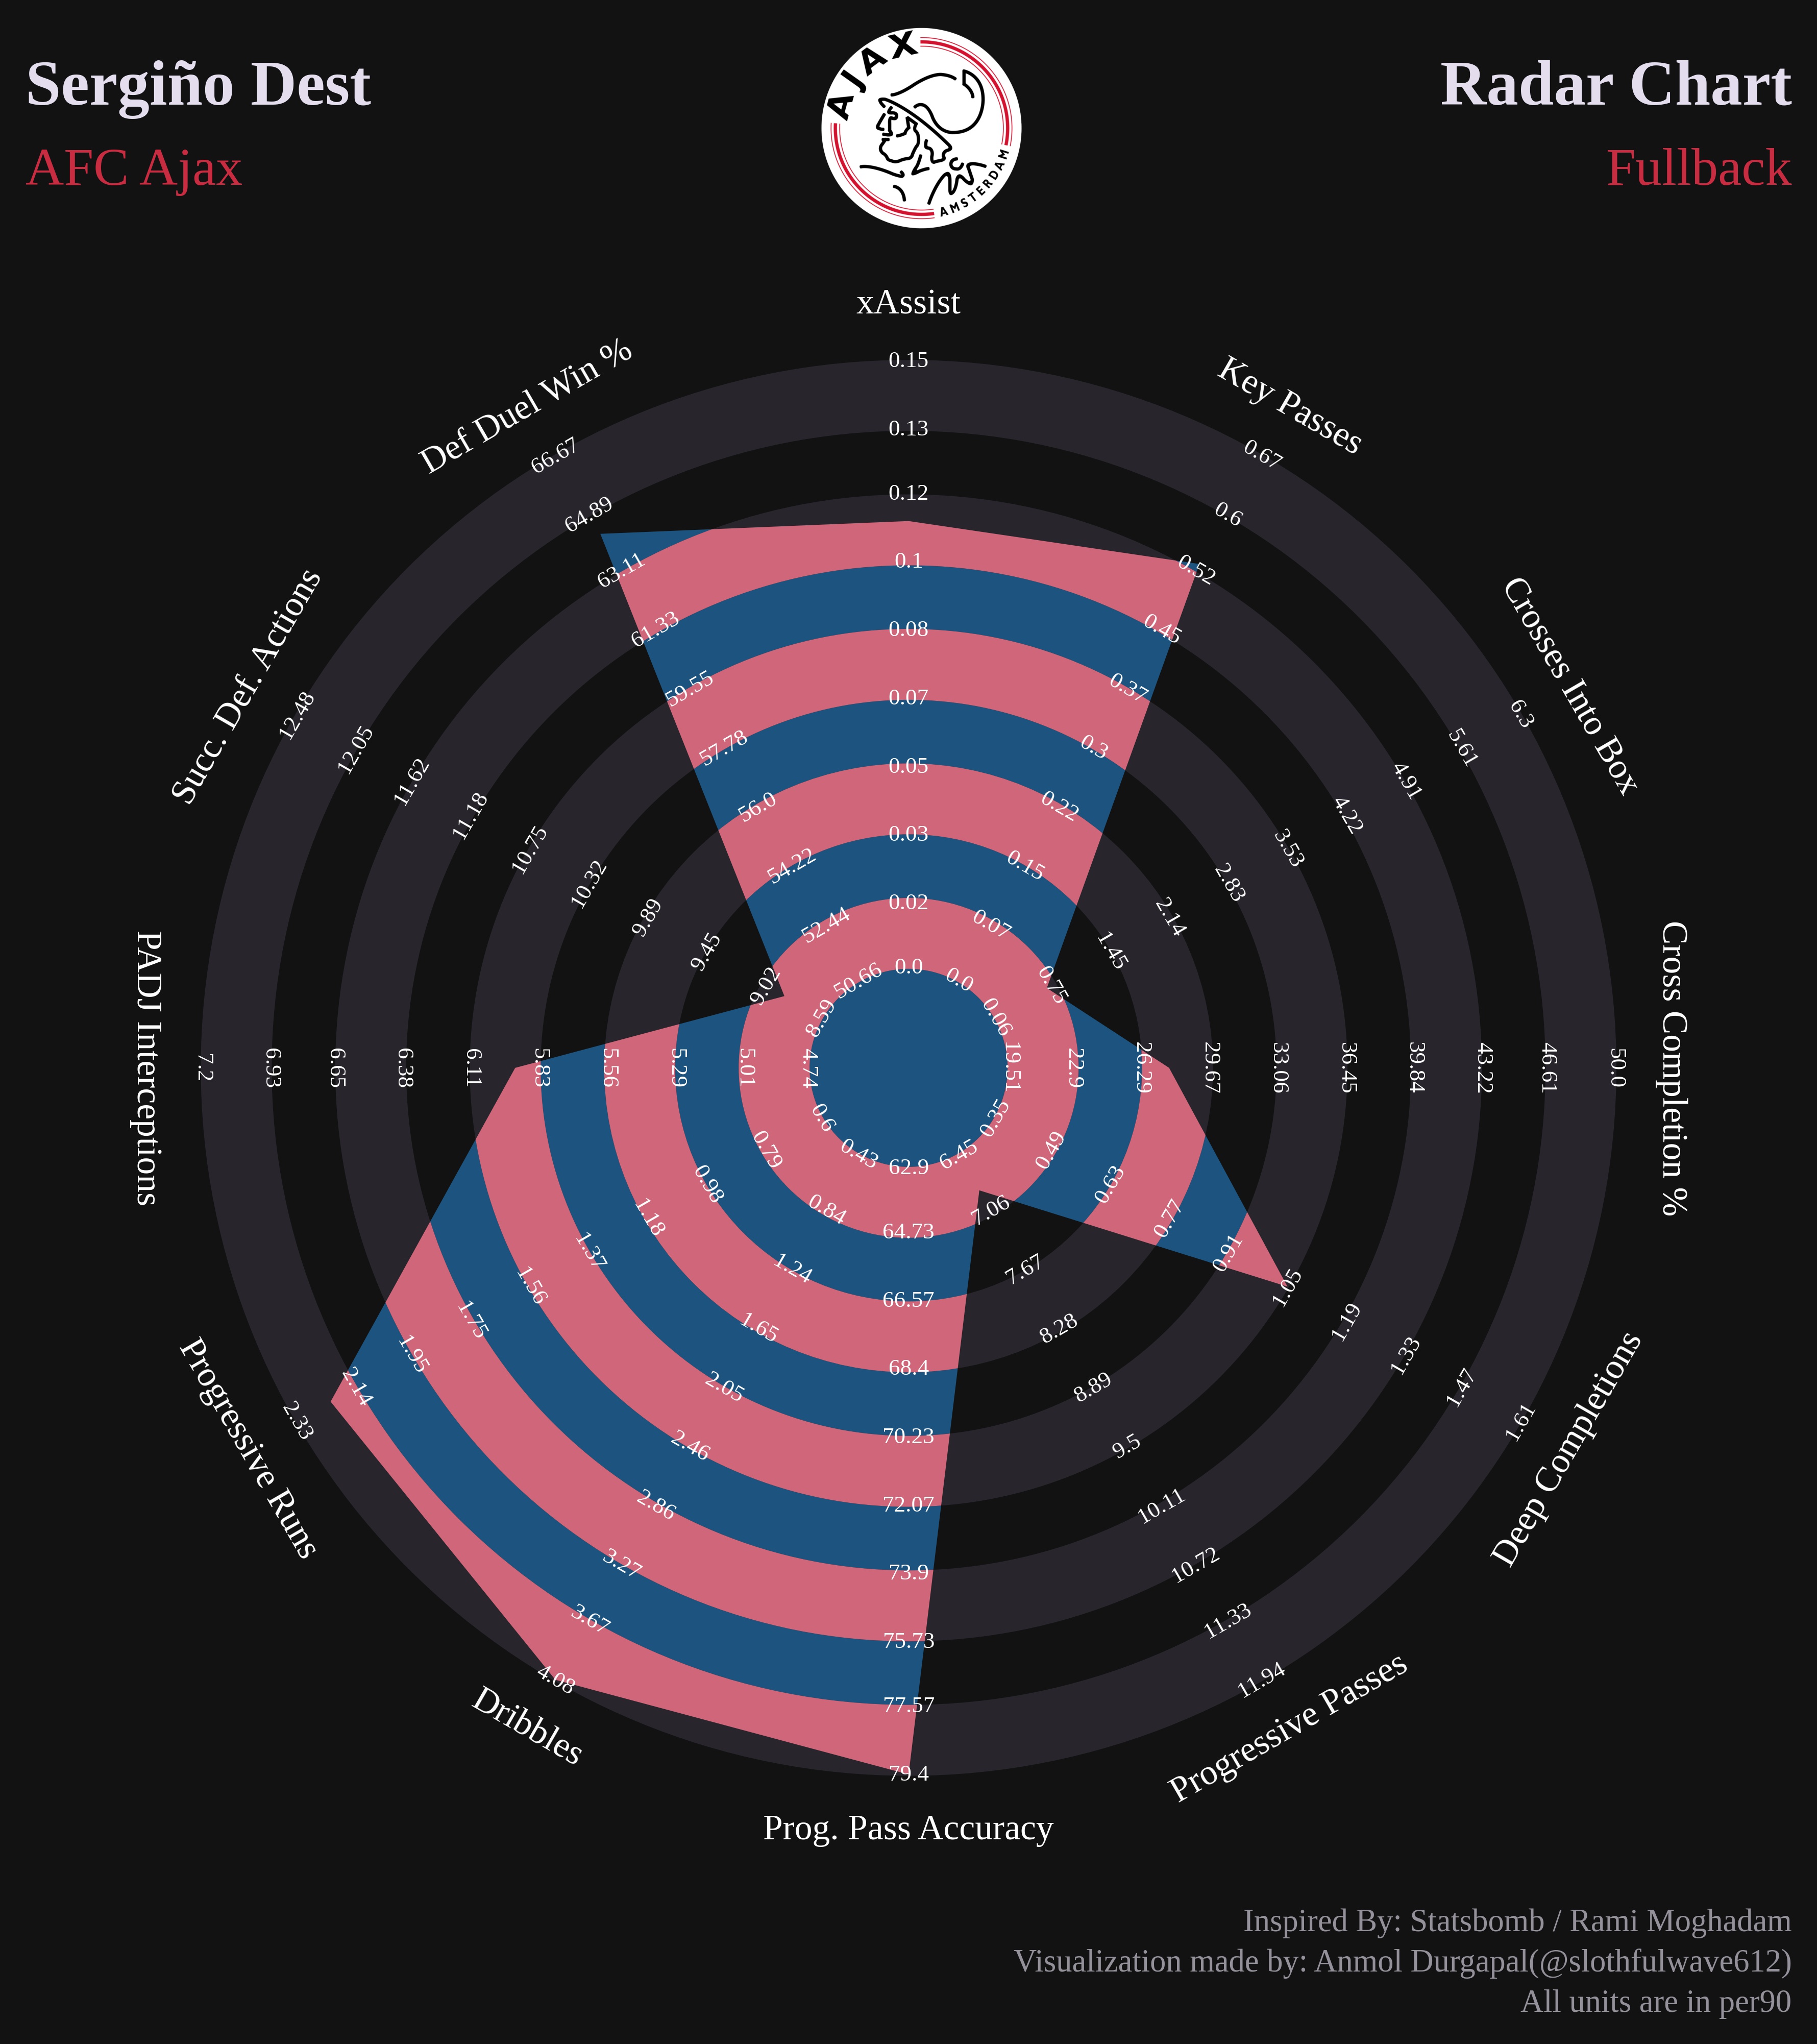
Adding Image in Dark Mode
- Code Snippet:
from soccerplots.radar_chart import Radar

## parameter names
params = ['xAssist', 'Key Passes', 'Crosses Into Box', 'Cross Completion %', 'Deep Completions',
          'Progressive Passes', 'Prog. Pass Accuracy', 'Dribbles', 'Progressive Runs',
          'PADJ Interceptions', 'Succ. Def. Actions', 'Def Duel Win %']

## range values
ranges = [(0.0, 0.15), (0.0, 0.67), (0.06, 6.3), (19.51, 50.0), (0.35, 1.61),
          (6.45, 11.94), (62.9, 79.4), (0.43, 4.08), (0.6, 2.33),
          (4.74, 7.2), (8.59, 12.48), (50.66, 66.67)]

## parameter value
values = [0.11, 0.53, 0.70, 27.66, 1.05, 6.84, 84.62, 4.56, 2.22, 5.93, 8.88, 64.29]

## title values
title = dict(
    title_name="Sergiño Dest",
    title_color="#E3DDED",
    subtitle_name="AFC Ajax",
    subtitle_color="#C72C41",
    title_name_2="Radar Chart",
    title_color_2="#E3DDED",
    subtitle_name_2='Fullback',
    subtitle_color_2='#C72C41',
    title_fontsize=18,
    subtitle_fontsize=15
)

## endnote
endnote = "Visualization made by: Anmol Durgapal(@slothfulwave612)\nAll units are in per90"

## instantiate object
radar = Radar(background_color="#121212", patch_color="#28252C", label_color="#FFFFFF",
              range_color="#FFFFFF")

## plot radar -- image link: http://bit.do/ajax_dark
fig, ax = radar.plot_radar(ranges=ranges, params=params,
                           values=values, radar_color=['#1c547f', '#CF6679'],
                           title=title, endnote=endnote,
                           image='ajax_dark.png', image_coord=[0.495, 0.805, 0.04, 0.1])
- Output:
Alpha value to image
-
One can pass the
alphavalue toplot_radarmethod to adjust the transparency of the image. -
Code Snippet:
from soccerplots.radar_chart import Radar

## parameter names
params = ['xAssist', 'Key Passes', 'Crosses Into Box', 'Cross Completion %', 'Deep Completions',
          'Progressive Passes', 'Prog. Pass Accuracy', 'Dribbles', 'Progressive Runs',
          'PADJ Interceptions', 'Succ. Def. Actions', 'Def Duel Win %']

## range values
ranges = [(0.0, 0.15), (0.0, 0.67), (0.06, 6.3), (19.51, 50.0), (0.35, 1.61),
          (6.45, 11.94), (62.9, 79.4), (0.43, 4.08), (0.6, 2.33),
          (4.74, 7.2), (8.59, 12.48), (50.66, 66.67)]

## parameter value
values = [0.11, 0.53, 0.70, 27.66, 1.05, 6.84, 84.62, 4.56, 2.22, 5.93, 8.88, 64.29]

## title values
title = dict(
    title_name="Sergiño Dest",
    title_color="#E3DDED",
    subtitle_name="AFC Ajax",
    subtitle_color="#C72C41",
    title_name_2="Radar Chart",
    title_color_2="#E3DDED",
    subtitle_name_2='Fullback',
    subtitle_color_2='#C72C41',
    title_fontsize=18,
    subtitle_fontsize=15
)

## endnote
endnote = "Visualization made by: Anmol Durgapal(@slothfulwave612)\nAll units are in per90"

## instantiate object
radar = Radar(background_color="#121212", patch_color="#28252C", label_color="#FFFFFF",
              range_color="#FFFFFF")

## plot radar
fig, ax = radar.plot_radar(ranges=ranges, params=params,
                           values=values, radar_color=['#1c547f', '#CF6679'],
                           title=title, endnote=endnote,
                           image='ajax_dark.png', image_coord=[0.495, 0.805, 0.04, 0.1],
                           alpha=0.7)
- Output:
Making Comparison Radar Chart
- Code Snippet:
from soccerplots.radar_chart import Radar

## parameter names
params = ['xAssists', 'Key Passes', 'Crosses Into Box', 'Cross Competion', 'Deep Completions',
          'Progressive Passes', 'Prog. Passes Accuracy%', 'Dribbles', 'Progressive Runs',
          'PADJ Interceptions', 'Succ. Def Actions', 'Def Duel Win%']

## range values
ranges = [(0.0, 0.15), (0.0, 0.67), (0.06, 0.63), (19.51, 50.0), (0.35, 1.61), (6.45, 11.94), (62.94, 79.46), (0.43, 4.08),
(0.6, 2.33), (5.01, 7.2), (9.02, 12.48), (52.44, 66.67)]

## parameter value
values = [
    [0.11, 0.53, 0.70, 27.66, 1.05, 6.84, 84.62, 4.56, 2.22, 5.93, 8.88, 64.29],   ## for Sergino Dest
    [0.07, 0.36, 0.16, 32.14, 1.04, 7.37, 74.46, 3.68, 2.40, 6.87, 8.97, 61.14]    ## for Nelson Semedo
]

## title
title = dict(
    title_name='Sergiño Dest',
    title_color='#9B3647',
    subtitle_name='AFC Ajax',
    subtitle_color='#ABCDEF',
    title_name_2='Nelson Semedo',
    title_color_2='#3282b8',
    subtitle_name_2='Barcelona',
    subtitle_color_2='#ABCDEF',
    title_fontsize=18,
    subtitle_fontsize=15,
)

## endnote
endnote = "Visualization made by: Anmol Durgapal(@slothfulwave612)\nAll units are in per90"

## instantiate object
radar = Radar(background_color="#121212", patch_color="#28252C", label_color="#F0FFF0",
              range_color="#F0FFF0")

## plot radar
fig, ax = radar.plot_radar(ranges=ranges, params=params, values=values,
                           radar_color=['#9B3647', '#3282b8'],
                           title=title, endnote=endnote,
                           alphas=[0.55, 0.5], compare=True)
- Output:

Some More Templates
-
Thanks to Gareth Cooper.
-
Contents:
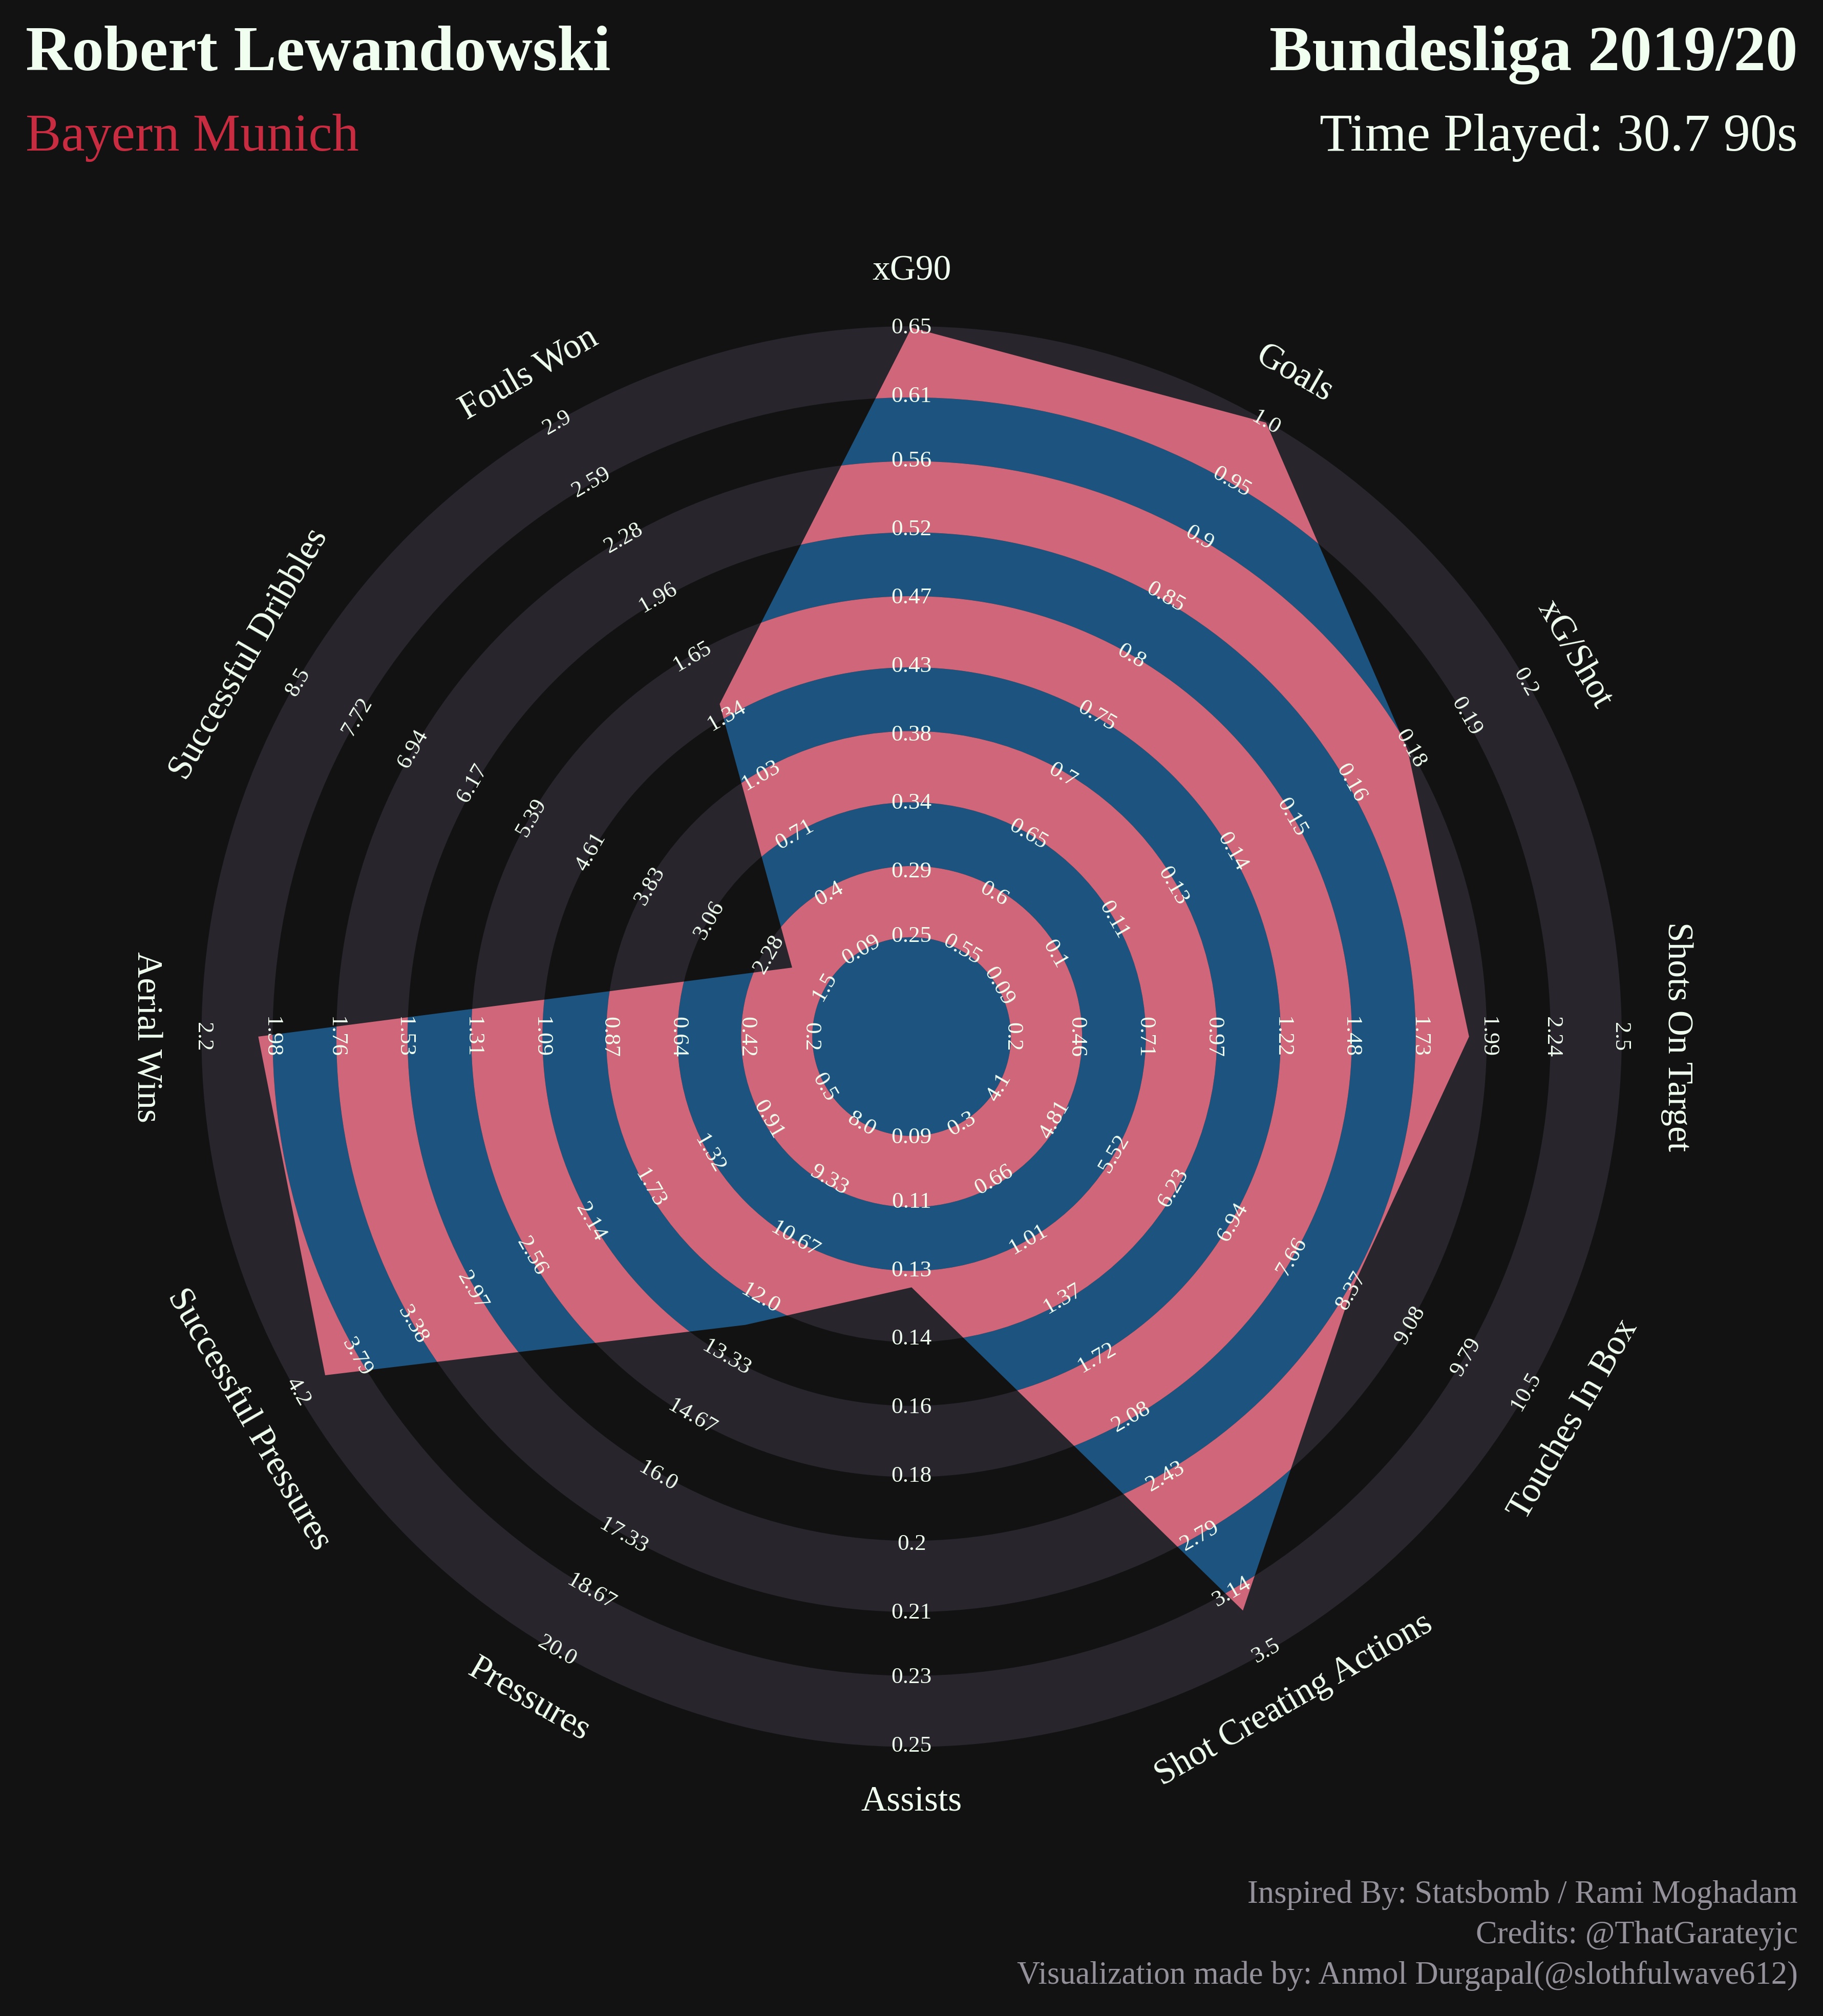
Robert Lewandowski
- Code Snippet:
from soccerplots.radar_chart import Radar

## parameter names
params = ["xG90", "Goals", "xG/Shot", "Shots On Target", "Touches In Box",
          "Shot Creating Actions", "Assists", "Pressures", "Successful Pressures",
          "Aerial Wins", "Successful Dribbles", "Fouls Won"]

## range values
ranges = [(0.25, 0.65), (0.55, 1.0), (0.09, 0.2), (0.2, 2.5), (4.1, 10.5),
          (0.3, 3.5), (0.09, 0.25), (8.0, 20.0), (0.5, 4.2),
          (0.2, 2.2), (1.5, 8.5), (0.09, 2.9)]

## parameter value
values = [0.90, 1.11, 0.175, 1.92, 8.37, 3.26, 0.13, 12.6, 4.01, 2.02, 1.95, 1.40]

## title values
title = dict(
    title_name="Robert Lewandowski",
    title_color="#F0FFF0",
    subtitle_name="Bayern Munich",
    subtitle_color="#C72C41",
    title_name_2="Bundesliga 2019/20",
    title_color_2="#F0FFF0",
    subtitle_name_2="Time Played: 30.7 90s",
    subtitle_color_2='#F0FFF0',
    title_fontsize=18,
    subtitle_fontsize=15
)

## endnote
endnote = "Credits: @ThatGarateyjc\nVisualization made by: Anmol Durgapal(@slothfulwave612)"

## instantiate object
radar = Radar(background_color="#121212", patch_color="#28252C", label_color="#F0FFF0",
              range_color="#F0FFF0")

## plot radar
fig, ax = radar.plot_radar(ranges=ranges, params=params,
                           values=values, radar_color=['#1c547f', '#CF6679'],
                           title=title, endnote=endnote)
- Output:
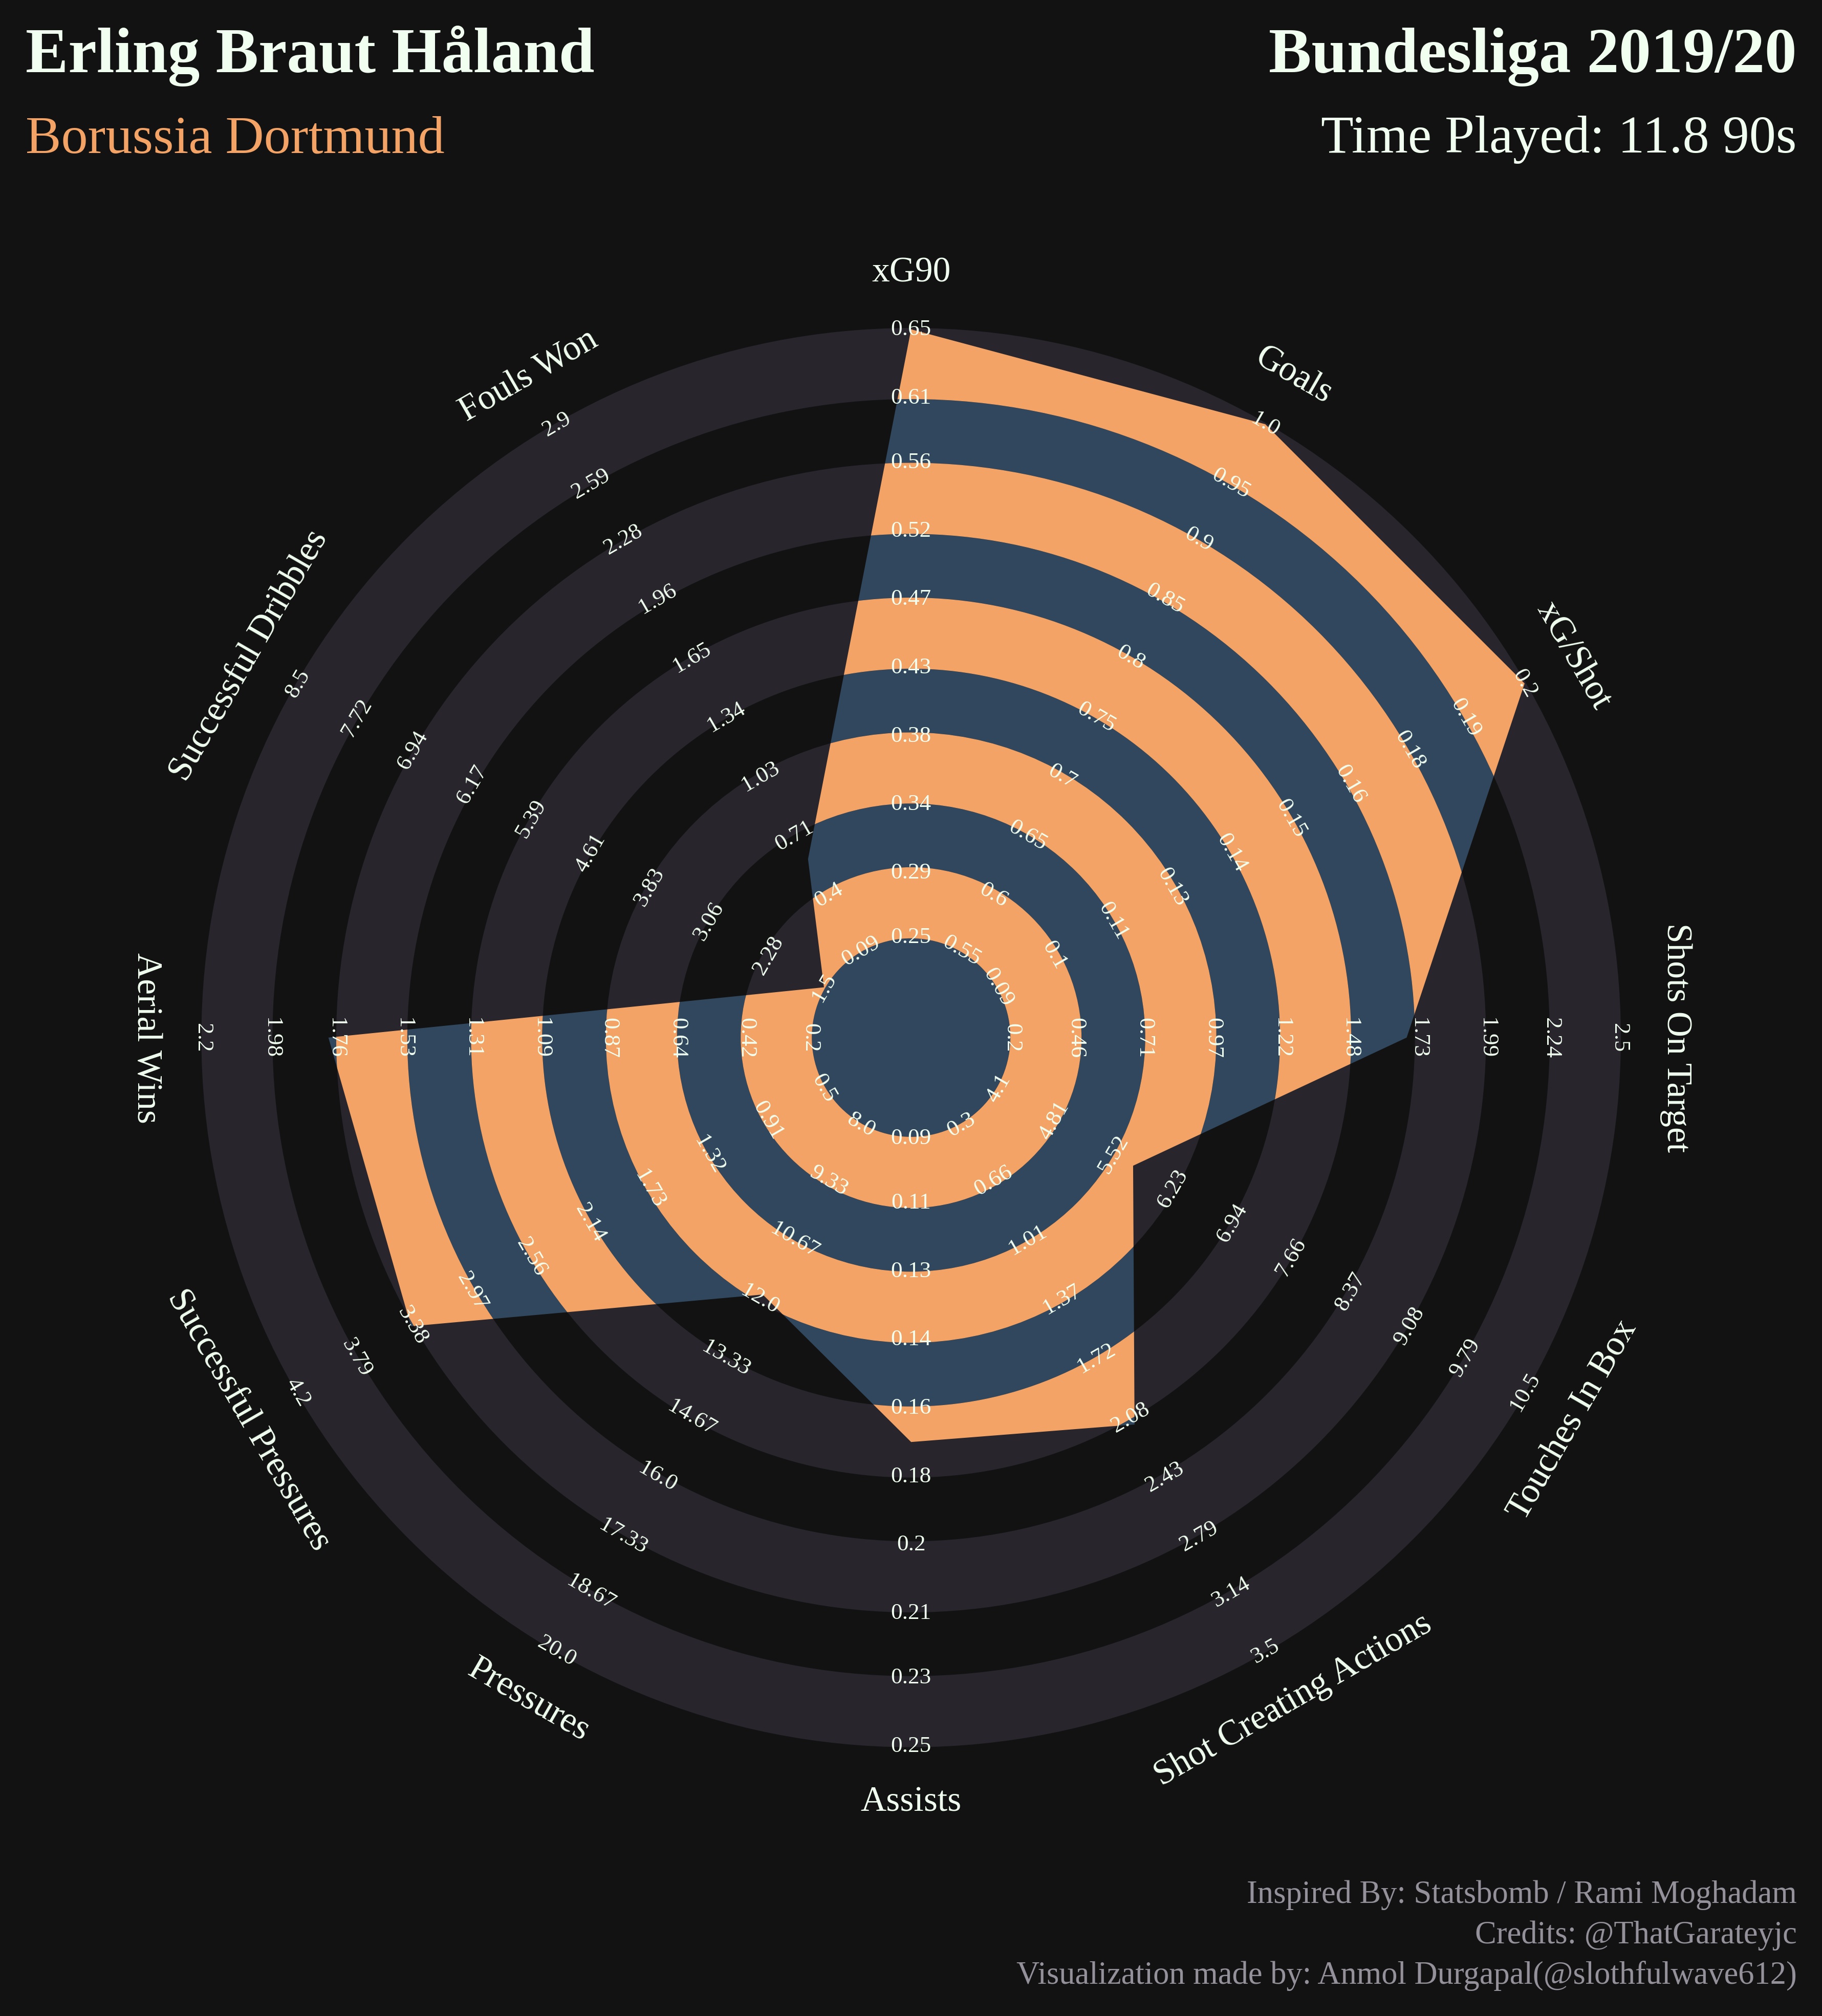
Erling Braut Håland
- Code Snippet:
from soccerplots.radar_chart import Radar

## parameter names
params = ["xG90", "Goals", "xG/Shot", "Shots On Target", "Touches In Box",
          "Shot Creating Actions", "Assists", "Pressures", "Successful Pressures",
          "Aerial Wins", "Successful Dribbles", "Fouls Won"]

## range values
ranges = [(0.25, 0.65), (0.55, 1.0), (0.09, 0.2), (0.2, 2.5), (4.1, 10.5),
          (0.3, 3.5), (0.09, 0.25), (8.0, 20.0), (0.5, 4.2),
          (0.2, 2.2), (1.5, 8.5), (0.09, 2.9)]

## parameter value
values = [0.69, 1.10, 0.23, 1.69, 5.76, 2.12, 0.17, 11.9, 3.39, 1.78, 1.02, 0.59]

## title values
title = dict(
    title_name="Erling Braut Håland",
    title_color="#F0FFF0",
    subtitle_name="Borussia Dortmund",
    subtitle_color="#F2A365",
    title_name_2="Bundesliga 2019/20",
    title_color_2="#F0FFF0",
    subtitle_name_2="Time Played: 11.8 90s",
    subtitle_color_2='#F0FFF0',
    title_fontsize=18,
    subtitle_fontsize=15
)

## endnote
endnote = "Credits: @ThatGarateyjc\nVisualization made by: Anmol Durgapal(@slothfulwave612)"

## instantiate object
radar = Radar(background_color="#121212", patch_color="#28252C", label_color="#F0FFF0",
              range_color="#F0FFF0")

## plot radar
fig, ax = radar.plot_radar(ranges=ranges, params=params,
                           values=values, radar_color=['#30475e', '#F2A365'],
                           title=title, endnote=endnote)
- Output:
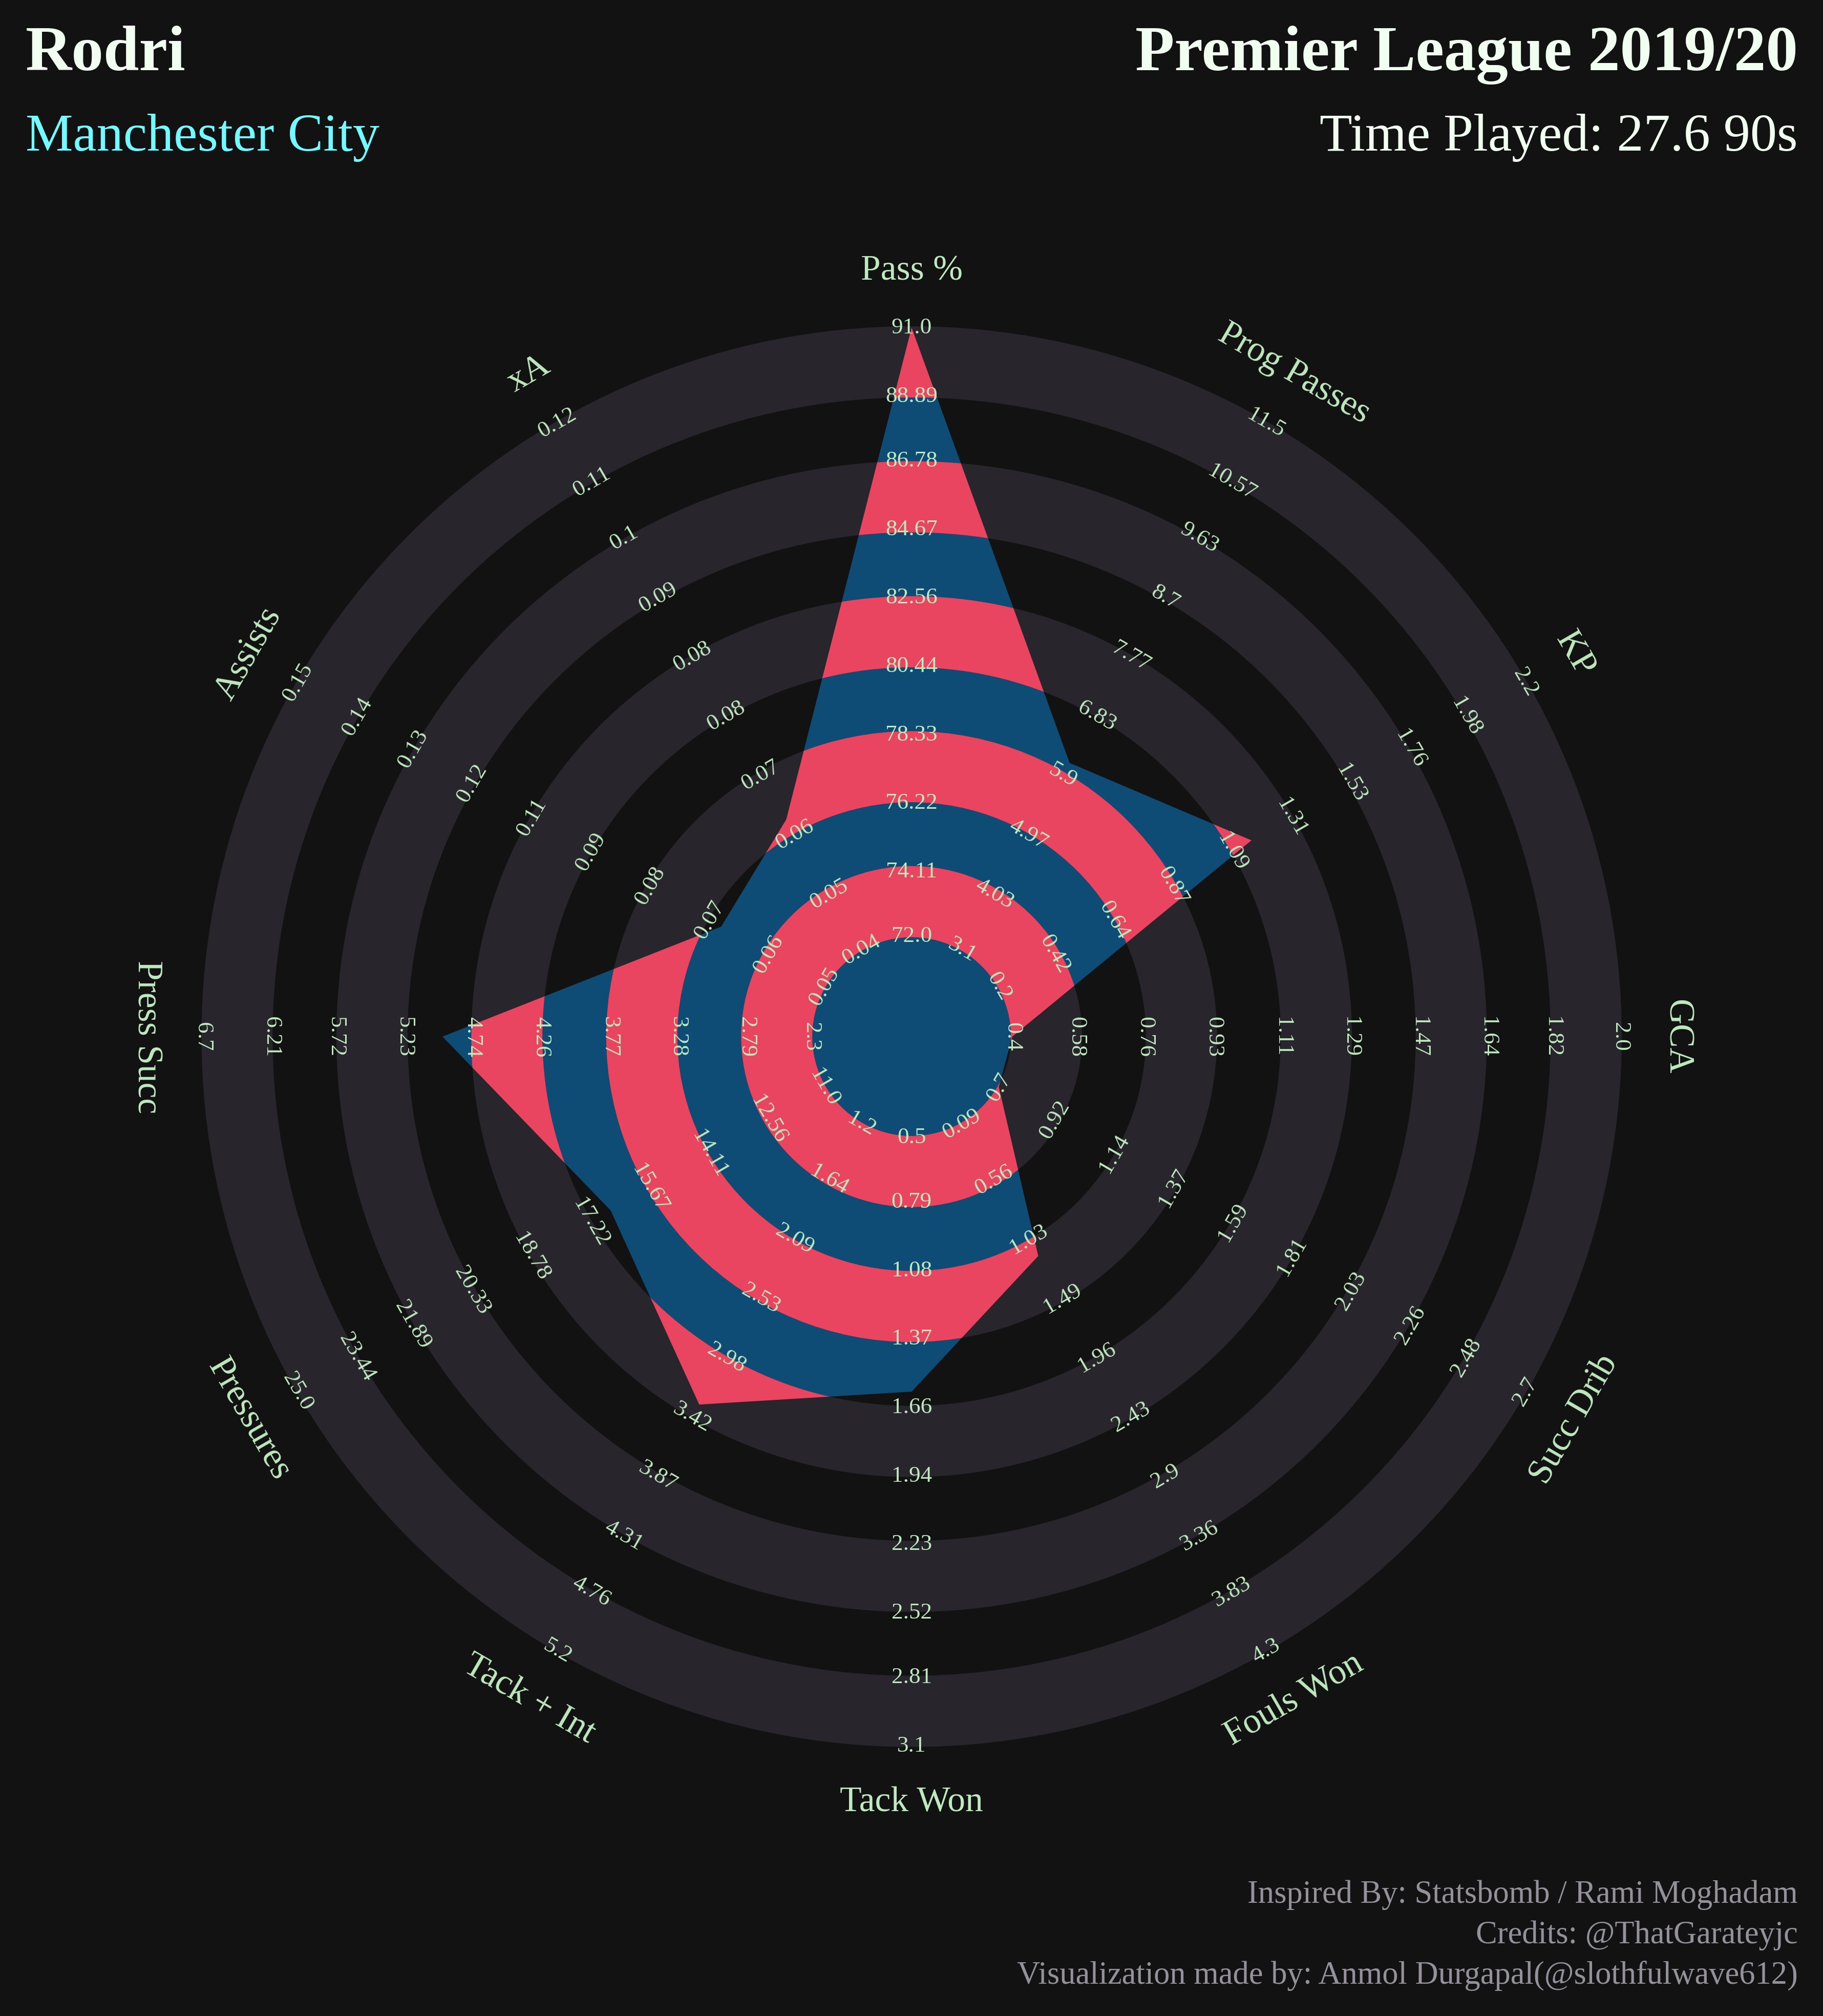
Rodri
- Code Snippet:
from soccerplots.radar_chart import Radar

## parameter names
params = ["Pass %", "Prog Passes", "KP", "GCA", "Succ Drib", "Fouls Won",
          "Tack Won", "Tack + Int", "Pressures", "Press Succ", "Assists", "xA"]

## range values
ranges = [(72.0, 91.0), (3.1, 11.5), (0.2, 2.2), (0.4, 2.0), (0.7, 2.7),
          (0.09, 4.3), (0.5, 3.1), (1.2, 5.2), (11.0, 25.0), (2.3, 6.7),
          (0.05, 0.15), (0.04, 0.12)]

## parameter value
values = [93.1, 6.09, 1.16, 0.11, 0.07, 1.16, 1.59, 3.33, 16.7, 4.96, 0.07, 0.06]

## title values
title = dict(
    title_name="Rodri",
    title_color="#F0FFF0",
    subtitle_name="Manchester City",
    subtitle_color="#73f9ff",
    title_name_2="Premier League 2019/20",
    title_color_2="#F0FFF0",
    subtitle_name_2="Time Played: 27.6 90s",
    subtitle_color_2='#F0FFF0',
    title_fontsize=18,
    subtitle_fontsize=15
)

## endnote
endnote = "Credits: @ThatGarateyjc\nVisualization made by: Anmol Durgapal(@slothfulwave612)"

## instantiate object
radar = Radar(background_color="#121212", patch_color="#28252C", label_color="#BFE9BF",
              range_color="#BFE9BF")

## plot radar
fig, ax = radar.plot_radar(ranges=ranges, params=params,
                               values=values, radar_color=['#0f4c75', '#e94560'],
                           title=title, endnote=endnote)
- Output: