token-history
June 10, 2026 · View on GitHub
The first AI-agent leaderboard where lines can go down.
Every public metric for AI agents is a ratchet. GitHub stars never decay. Download counts only grow. A benchmark score is a photo taken once. Six months after launch, a dead agent looks identical to a thriving one — and the metric everyone screens by is openly for sale at $0.10–$2.00 a star (~6M fake stars found; ICSE 2026).
Token usage is the one public signal with a heartbeat: somebody pays for every token, every week, or the line falls. In May 2026, Hermes Agent overtook OpenClaw in real usage with half the stars — the star charts never moved, and the flip went mostly unnoticed for days.
In plain words: the world now runs on AI "agents" — assistants that work around the clock. The only public scoreboard people check is GitHub stars, and stars can be bought and never go down. This site keeps the daily history of which agents and models people actually use (measured in paid tokens) — so you can see what's genuinely rising, what's quietly dying, prove it with a chart link, and get an alert the day the leaderboard flips.
It went unnoticed because the data evaporates. OpenRouter publishes a live App & Agent Rankings board — tokens actually burned per app — but there's no historical API: yesterday's leaderboard is gone forever. token-history archives it daily. The archive is the product.
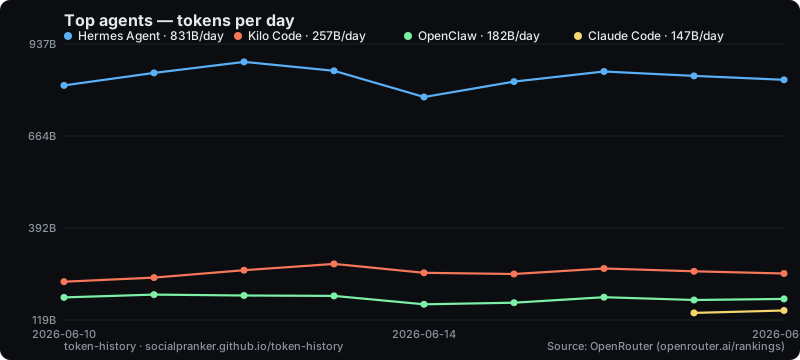
Who needs this
- Picking an agent? npm-trends for agents: is the tool you're about to adopt growing — or quietly bleeding out? A trend, not a snapshot.
- Maintaining one? A
tokens/weekbadge — the one badge you can't buy — plus an automatic alert the day a competitor passes you. - Covering or funding the space? Every leaderboard flip auto-files an issue. Headlines, detected before anyone notices.
- Studying it? The only public longitudinal dataset of AI-agent usage. Plain JSON, daily, no key.
What you get:
- 📈 Compare charts —
https://socialpranker.github.io/token-history/#openclaw&hermes-agent, star-history-style shareable URLs - 🗄️ A permanent public archive — plain JSON files in this repo, fetchable via raw URLs, no key needed
- 🏷️ README badges — live
tokens/daybadge for your agent via shields.io — the one badge you can't buy - ⚡ Overtake alerts — a GitHub issue is filed automatically whenever one app passes another ("X just passed Y"). Watch this repo to get them by email.
- 📉 Decline alerts — an issue when an app loses ≥40% of usage in ~30 days. The story star charts are structurally incapable of telling. (Arms itself once the archive is ~30 days old.)
- 🔭 Attention vs usage — dashed GitHub-star overlay on the token chart for apps mapped in
repos.json, plus a Hype Gap table (stars per billion daily tokens: who's loud, who's a workhorse) - 🧪 Depth metric — tokens/request per app: agentic tools burn tens of thousands of tokens per request, chat apps don't
- 🖼️ Embeddable live SVG charts — regenerated twice a day, served from Pages (see below)
- 🚀 Momentum — from a single snapshot: who's running above (▲) or below (▼) their own weekly pace today
- 📰 Weekly digest — Monday issue: gainers, losers, new top-20 entrants, overtakes, category shares. Watch the repo = subscribe.
- 📡 Atom feed of all events (overtakes, declines, new entrants) — no account needed
No server. No database. GitHub Actions snapshots the data twice a day and commits it here (git scraping). The archive is the repo — every day it runs, it becomes harder to replicate.
Use the data
# latest snapshot pointer
curl -s https://raw.githubusercontent.com/Socialpranker/token-history/main/data/latest.json

# full snapshot for a day
curl -s https://raw.githubusercontent.com/Socialpranker/token-history/main/data/apps/2026-06-10.json

# per-app time series:
# points = [date, day_tokens, day_rank, day_requests, stars, week_tokens, week_rank]
curl -s https://raw.githubusercontent.com/Socialpranker/token-history/main/data/series/openclaw.json
data/index.json — current ranking + app list. data/overtakes.json — every detected overtake event.
Badge & live chart for your README

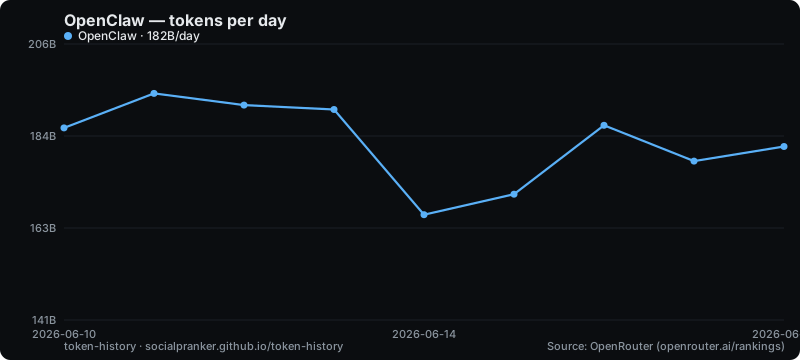
Replace openclaw with your app's slug (see data/index.json). Both update twice a day automatically — the chart is your app's real usage curve, not a screenshot.
Run your own
- Fork (or use this repo as a template).
- Settings → Actions → enable workflows. Settings → Pages → deploy from
main, root. - Actions → collect → Run workflow — first snapshot lands in
data/, the site goes live. - The cron does the rest (twice a day). If extraction ever breaks, the run fails loudly — you get a red workflow, not silent garbage. (GitHub-star fetching is an enhancement layer and fails soft.)
repos.json maps app slugs to GitHub repos for the star overlay / Hype Gap — extend it freely; wrong or missing entries are skipped with a warning, never fatal.
Zero dependencies: Node 20+. npm run selftest runs the offline test suite (18 tests).
Methodology — read before quoting
- Data comes from the JSON endpoint the rankings page itself fetches (
/api/frontend/rankings/apps): true daily token totals, plus week and month windows — all three are archived in every snapshot. Series and badges use the day window; overtake/decline alerts use the stabler week window. This endpoint is undocumented and may change — the collector falls back to parsing the page HTML and fails loudly if both break. (For models, OpenRouter has an official daily dataset API back to 2025-01-01; for apps there is no documented API and no history — that's the gap this repo fills.) - Visibility bias: only traffic routed through OpenRouter is counted. Apps calling providers directly (e.g. subscription products like Claude Code on Anthropic plans) are undercounted. This is a relative trend signal, not absolute adoption.
- Token counts come from each provider's own tokenizer; rows from different providers are not strictly comparable.
- Momentum (
day×7 / week) compares today's pace with the app's own trailing week — it's a same-app, same-tokenizer ratio, but a single hot day (or a UTC-boundary artifact) can move it; treat ▲/▼ as a hint, not a verdict. - Data attribution, as required by OpenRouter: "Source: OpenRouter (openrouter.ai/rankings)" — kept in every snapshot's
meta.citation.
Not affiliated with OpenRouter. One data fetch per run, standard UA with contact link.
Why not stars
Stars are bought for $0.10–$2.00 apiece; 16.66% of repos with 50+ stars were touched by fake-star campaigns at the July 2024 peak (ICSE 2026 study). Stars also measure a moment of attention — a launch, a HN spike — not whether anyone still uses the thing. Token volume is a running cost someone keeps paying. It's the closest public proxy for "this agent is actually working for people", and it deserves the same historical record stars have had for years.
Roadmap
- Star backfill (sampled). Forward star snapshots already ship; retroactive star curves via stargazer-page sampling (the star-history method — exact under 40k stars, approximate above). Token history, by contrast, cannot be backfilled at all — that's why this archive had to start first.
- Embeddable SVG chart for READMEs, like star-history's.
- RSS / X bot for overtake & decline events.
- Models layer from the official datasets API (model history exists there since 2025-01-01; the apps archive remains the part that exists nowhere else).
License
MIT. Data © OpenRouter, cited per their dataset terms.