@angx/ngx-circle-chart
August 3, 2026 · View on GitHub
Beautiful, auto-scaling circle (doughnut) progress chart for Angular.
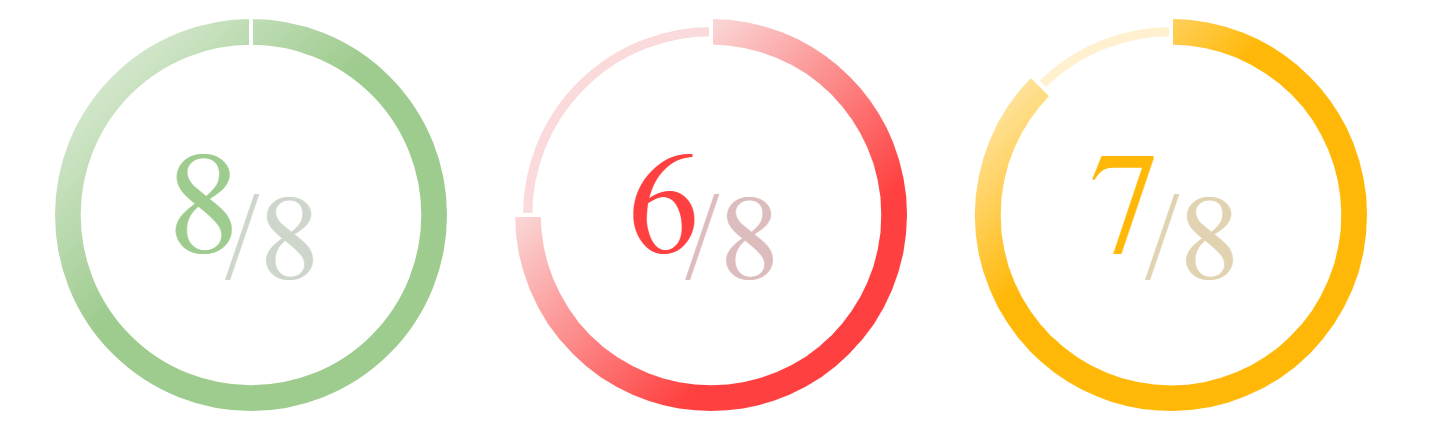
Built directly on chart.js.
Features
- Value label scales itself to fit the ring, at any size
- Optional gradient colouring along the progress arc
- Themeable colours, size and font
- Zoneless and SSR safe — no canvas work happens on the server
- Registers only the doughnut controller, not all of
chart.js/auto - Standalone component, no
NgModulerequired
Requirements
| Angular | 21 or 22 |
| chart.js | ^4.4.0 |
Install
npm i @angx/ngx-circle-chart chart.js
chart.js is a peer dependency, so install it alongside.
Usage
import { Component } from '@angular/core';
import { NgxCircleChartComponent } from '@angx/ngx-circle-chart';

@Component({
  selector: 'app-stats',
  imports: [NgxCircleChartComponent],
  template: `
    <circle-chart
      [value]="6"
      [maxValue]="8"
      color="#FF4040"
      bgColor="#FADADA"
      [gradientColoring]="true"
      [dimensionsInPixels]="200"
    />
  `,
})
export class StatsComponent {}
The chart updates automatically whenever an input changes — bind a signal and it follows.
Inputs
| Input | Type | Default | Description |
|---|---|---|---|
value | number | required | Current value. Clamped into [0, maxValue]. |
maxValue | number | required | Value that represents a full circle. |
color | string | '#0076ff' | Progress arc and value text. |
bgColor | string | '#e7e9ed' | Background track, and (darkened) the /maxValue text. |
gradientColoring | boolean | false | Fade the arc from color towards bgColor. |
dimensionsInPixels | number | 45 | Width and height, in CSS pixels. |
fontFamily | string | system stack | Font used for the centre label. |
Migrating from 3.x
- Angular 21+ is required, and the workspace targets Angular 22.
ng2-chartsis no longer needed. It was a peer dependency and pulled@angular/cdkin with it. Unless you use them elsewhere:npm uninstall ng2-chartsvalueandmaxValueare now required inputs — the compiler will tell you if one is missing.- New optional
fontFamilyinput. - Inputs are signal-based internally; template bindings are unchanged.
Fixed in 4.0.0
- The chart never redrew when its inputs changed — it was built once in
ngAfterViewInit. - Every instance emitted
id="chart"andid="chart-foreground", so two charts on one page collided and the centre label was measured against the wrong element. - The label colour helper dropped leading zeros (
#0f1e2ddarkened to the invalid#51423), silently breaking the/maxValuetext. - A
valuegreater thanmaxValueproduced a negative arc segment. - Charts were never destroyed, leaking a chart.js instance per component.
- Canvas code ran during server-side rendering.
- The centre label is now genuinely centred rather than offset by a hard-coded fudge factor.
Development
npm install
npm run build:lib   # build the package into dist/angx/ngx-circle-chart
npm start           # build the lib, then serve the demo app
npm test            # run the library unit tests
The demo app is deployed to GitHub Pages from master by .github/workflows/deploy-demo.yml.
Support
If you like my work and feel like buying me a coffee, please feel free to do so:
License
MIT © Abhishek Singh