Qlik-Sense-Network-Arrow-Chart
April 7, 2021 · View on GitHub
Qlik Sense Network Arrow Chart
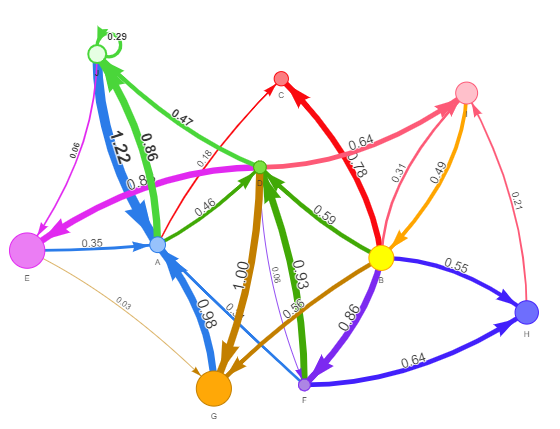
Based on library vis.js (http://visjs.org)
https://github.com/miclae76/network-vis-chart
Dimensions
- Node identifier: This dimension controls which nodes are presented in the chart.
- Node label: This dimension sets the label of each node.
- Node parent: This dimension sets the parent of a node, and controls the relationships between nodes. It needs to contain the value of the node identifier of the parent to connect to.
- Node group (Color): You can use this dimension to group nodes. All nodes in the same group will have the same color.
Measures
- Tooltip: You can set a measure value that is displayed in a tooltip when hovering over a node.
- Node size: You can set the size of the node according to a measure.
- Edge size: You can set the width of the lines between nodes according to a measure.
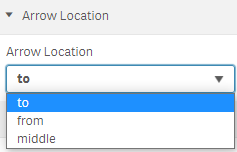
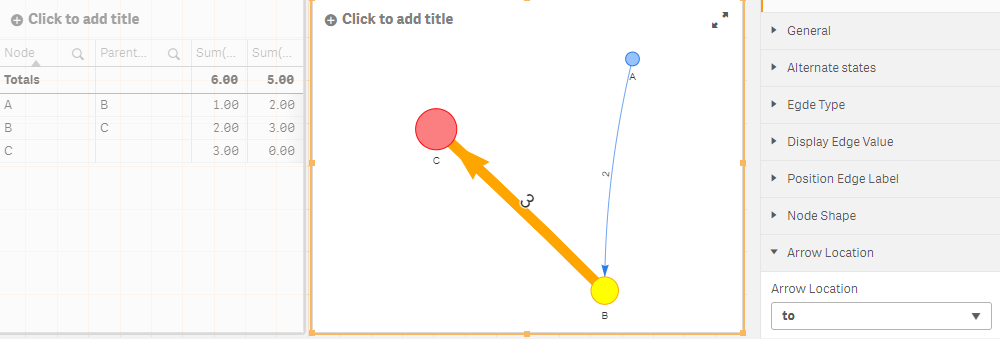
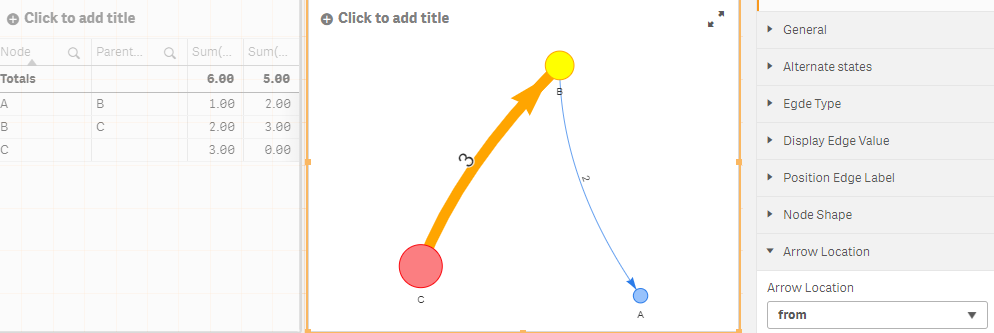
Arrows (Added Option)
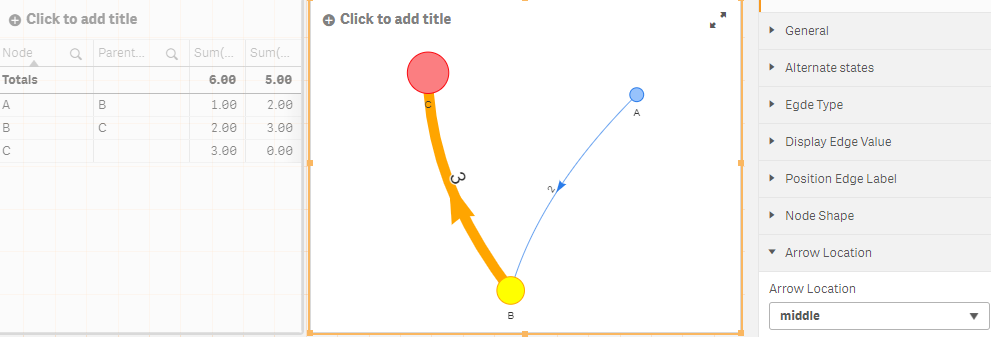
Node Identifier
The string field can work.
Sample App
https://github.com/arumjin/Qlik-Sense-Network-Arrow-Chart/tree/main/qvf
NodeData:
Load Chr(rand()*26+65) as Node,
    Chr(rand()*10+65) as ParentNode,
    Rand()*10 as NodeSize,
    Rand()*10 as EdgeSize
AutoGenerate 50;
with Qlik Sense bundle
