FlashDeconv
June 30, 2026 · View on GitHub

![]()
![]()
![]()
![]()
Spatial deconvolution with linear scalability for atlas-scale data.
FlashDeconv estimates cell type proportions from spatial transcriptomics data (Visium, Visium HD, Stereo-seq). It is designed for large-scale analyses where computational efficiency is essential, while maintaining attention to low-abundance cell populations through leverage-score-based feature weighting.
Paper: Yang, C., Zhang, X. & Chen, J. FlashDeconv enables atlas-scale, multi-resolution spatial deconvolution via structure-preserving sketching. bioRxiv (2025). DOI: 10.64898/2025.12.22.696108
Installation
pip install flashdeconv
For development or additional I/O support, see Installation Options.
Quick Start
import scanpy as sc
import flashdeconv as fd

# Load data
adata_st = sc.read_h5ad("spatial.h5ad")
adata_ref = sc.read_h5ad("reference.h5ad")

# Deconvolve
fd.tl.deconvolve(adata_st, adata_ref, cell_type_key="cell_type")

# Results stored in adata_st.obsm["flashdeconv"]
sc.pl.spatial(adata_st, color="flashdeconv_dominant")
FlashDeconv is also available as a tool in ChatSpatial, an MCP server for spatial transcriptomics — run deconvolution through natural language from any compatible client.
Overview
Spatial deconvolution methods offer different trade-offs. Probabilistic approaches like Cell2Location and RCTD provide rigorous uncertainty quantification; methods like CARD incorporate spatial structure through dense kernel matrices. FlashDeconv takes a complementary approach, prioritizing computational efficiency for million-scale datasets.
Design Principles
-
Linear complexity — O(N) time and memory through randomized sketching and sparse graph regularization.
-
Leverage-based feature weighting — Variance-based selection (PCA, HVG) can underweight markers of low-abundance populations. We use leverage scores from the reference SVD to identify genes that define distinct transcriptomic directions, regardless of expression magnitude.
-
Sparse spatial regularization — Graph Laplacian smoothing with O(N) complexity, avoiding the O(N²) cost of dense kernel methods.
Performance
Scalability
| Spots | Time | Memory |
|---|---|---|
| 10,000 | < 1 sec | < 1 GB |
| 100,000 | ~4 sec | ~2 GB |
| 1,000,000 | ~3 min | ~21 GB |
Benchmarked on MacBook Pro M2 Max (32GB unified memory), CPU-only.
Accuracy
On the Spotless benchmark:
| Metric | FlashDeconv | RCTD | Cell2Location |
|---|---|---|---|
| Pearson (56 datasets) | 0.944 | 0.905 | 0.895 |
Performance varies by tissue type and experimental conditions. We recommend evaluating on data similar to your use case.
Algorithm
FlashDeconv solves a graph-regularized non-negative least squares problem:
minimize ½‖Y - βX‖²_F + ½λ·Tr(βᵀLβ) + ρ‖β‖₁, subject to β ≥ 0
where Y is spatial expression, X is reference signatures, L is the graph Laplacian, and β represents cell type abundances.
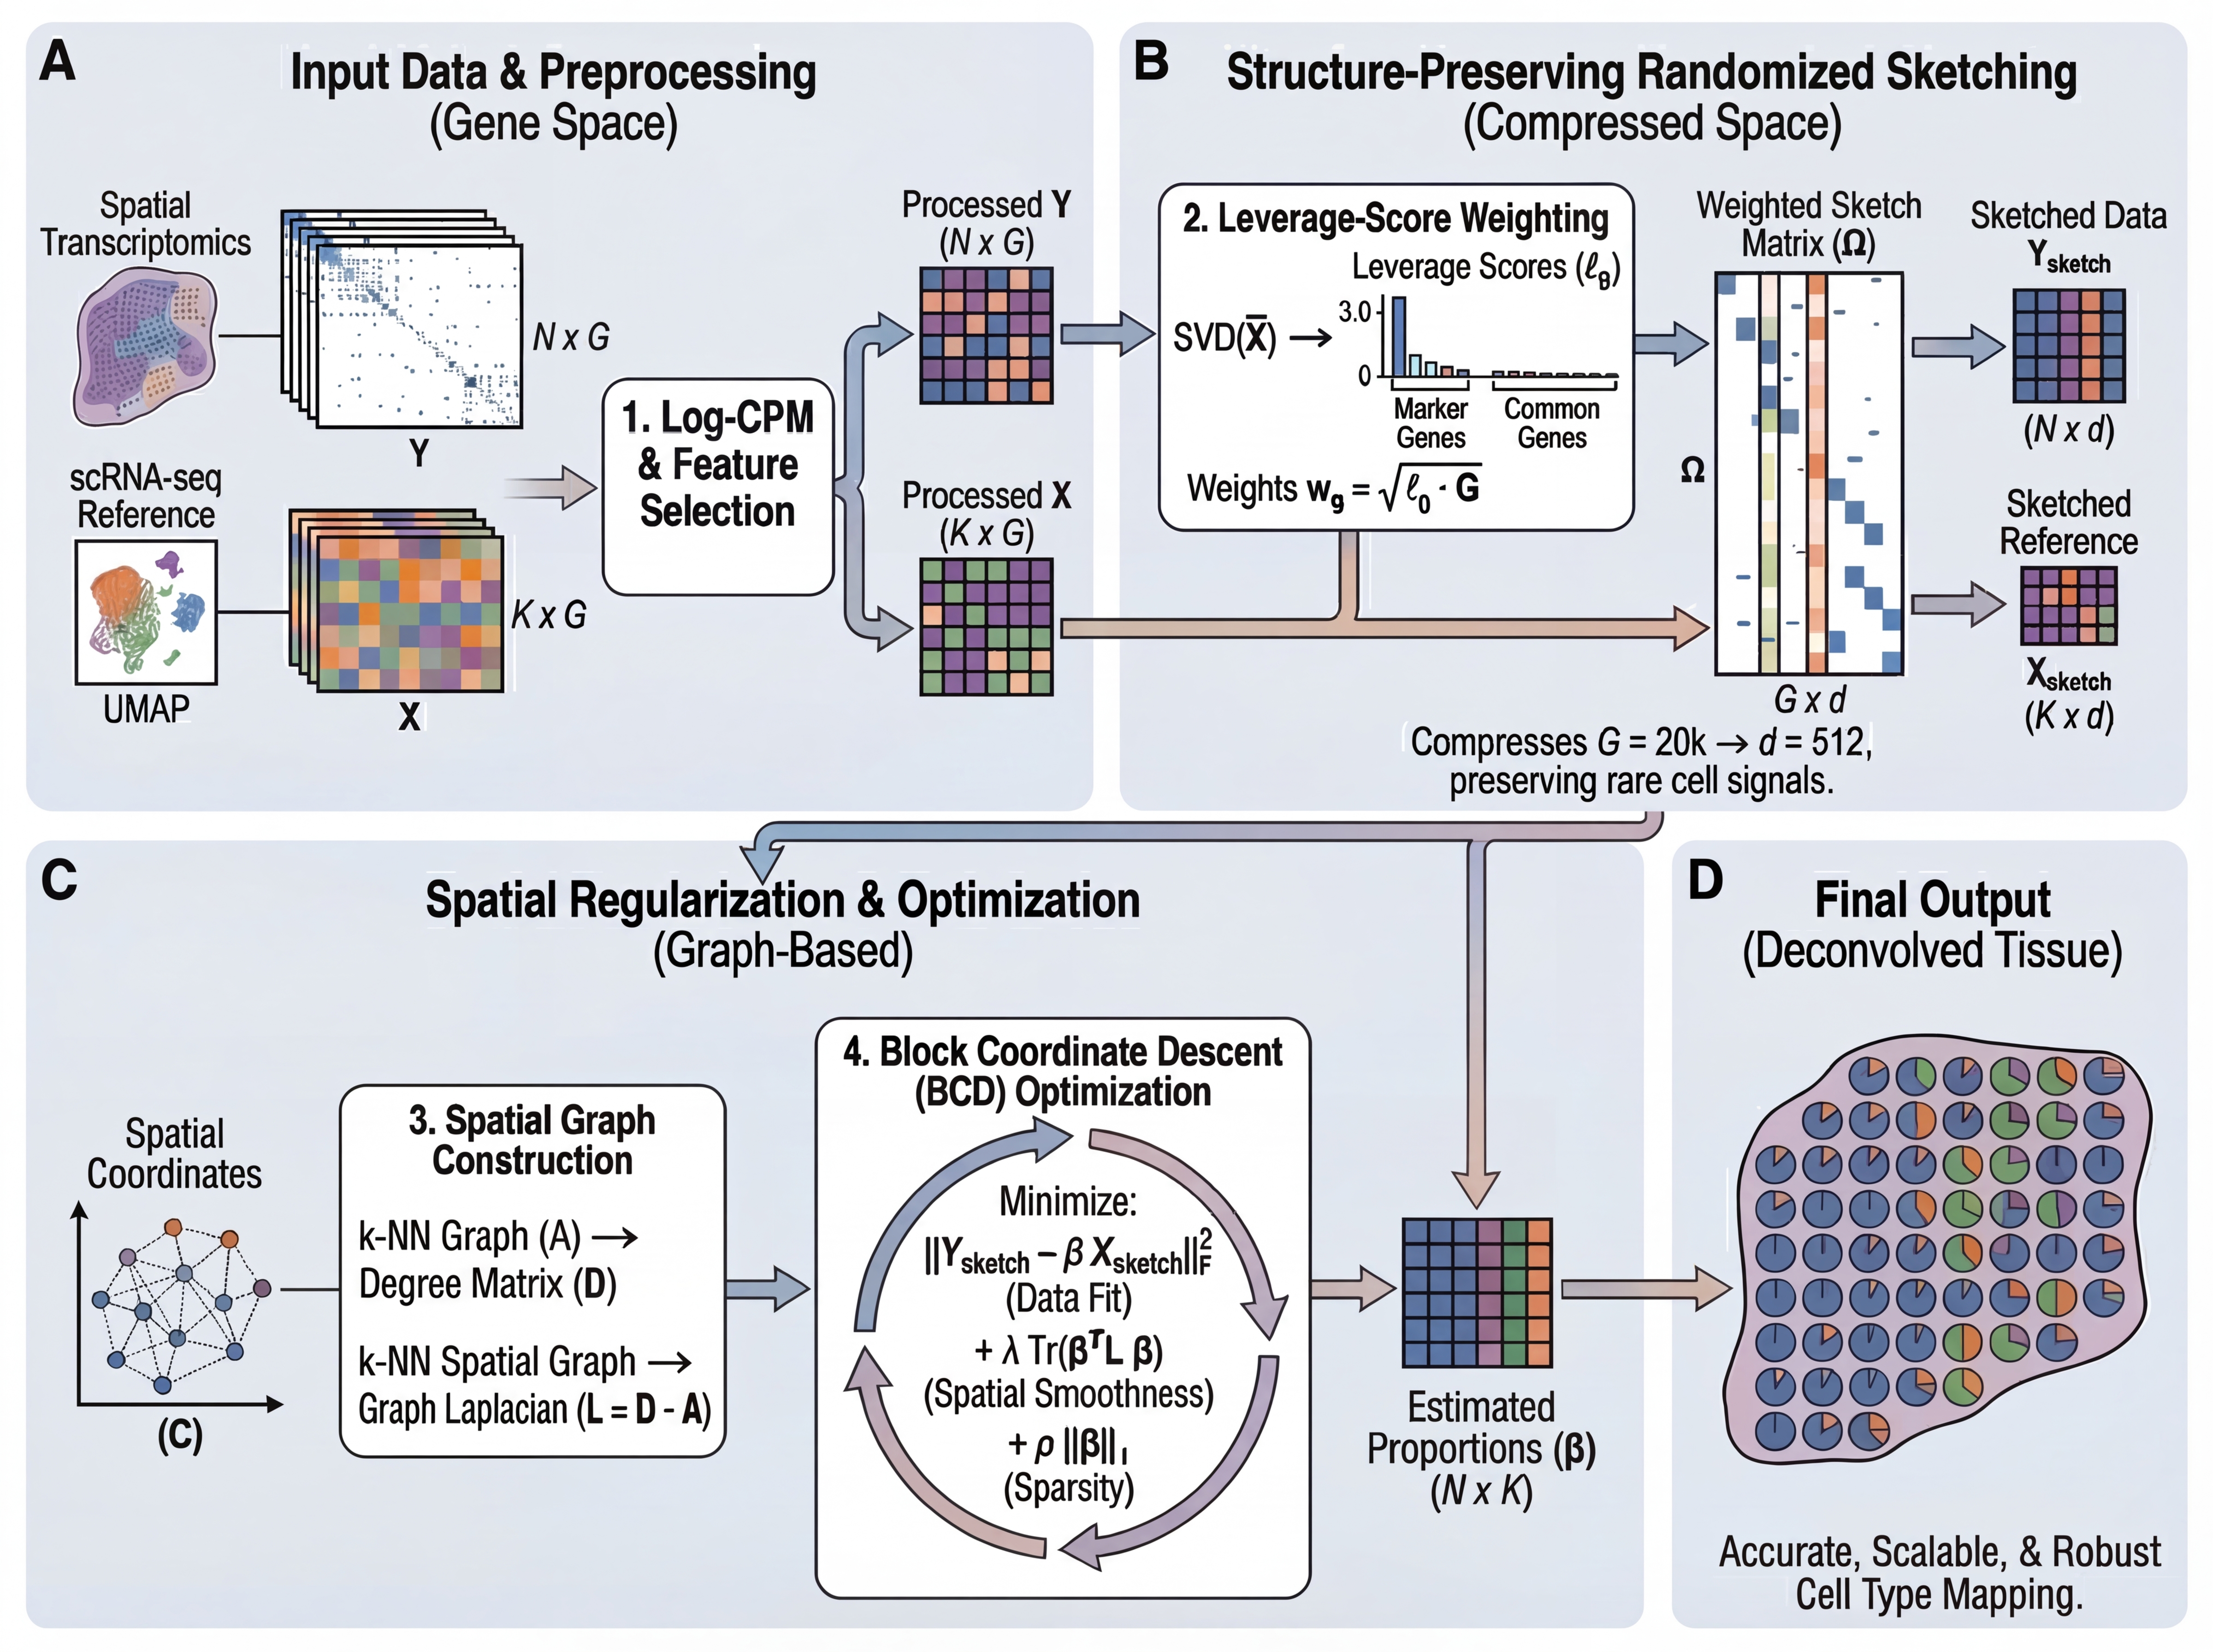
Pipeline:
- Select informative genes (HVG ∪ markers) and compute leverage scores
- Compress gene space via CountSketch with uniform hashing + leverage-weighted amplitudes (G → 512 dimensions)
- Construct sparse k-NN spatial graph
- Solve via block coordinate descent with spatial smoothing
API
Scanpy-style
fd.tl.deconvolve(
    adata_st,                    # Spatial AnnData
    adata_ref,                   # Reference AnnData
    cell_type_key="cell_type",   # Column in adata_ref.obs
    key_added="flashdeconv",     # Key for results
)
NumPy
from flashdeconv import FlashDeconv

model = FlashDeconv(
    sketch_dim=512,
    lambda_spatial="auto",
    n_hvg=2000,
    k_neighbors=6,
    random_state=0,
)
proportions = model.fit_transform(Y, X, coords)
Parameters
| Parameter | Default | Description |
|---|---|---|
sketch_dim | 512 | Sketch dimension |
lambda_spatial | "auto" | Spatial regularization (auto-tuned) |
rho_sparsity | 0.01 | L1 sparsity penalty (dimensionless fraction) |
n_hvg | 2000 | Highly variable genes |
n_markers_per_type | 50 | Marker genes per cell type |
spatial_method | "knn" | Graph method: "knn", "radius", or "grid" |
k_neighbors | 6 | Spatial graph neighbors (for "knn") |
radius | None | Neighbor radius (required for "radius") |
preprocess | "log_cpm" | Normalization: "log_cpm", "pearson", or "raw" |
random_state | 0 | Random seed for reproducibility |
Output
| Attribute | Description |
|---|---|
| `proportions_$ | \text{Cell} \text{type} \text{proportions} (\text{N} \times \text{K}), \text{sum} \text{to} 1 |
| $beta_` | Raw abundances (N × K) |
info_ | Convergence statistics |
API Reference
flashdeconv.FlashDeconv
Main class for spatial deconvolution.
from flashdeconv import FlashDeconv

model = FlashDeconv(sketch_dim=512, lambda_spatial="auto", ...)
Constructor parameters
| Parameter | Type | Default | Description |
|---|---|---|---|
sketch_dim | int | 512 | Dimension of the randomized sketch space. |
lambda_spatial | float or "auto" | "auto" | Spatial regularization strength. "auto" tunes based on data scale. |
rho_sparsity | float | 0.01 | L1 sparsity penalty (dimensionless fraction, internally scaled). |
n_hvg | int | 2000 | Number of highly variable genes to select. |
n_markers_per_type | int | 50 | Number of marker genes per cell type. |
spatial_method | str | "knn" | Graph construction: "knn", "radius", or "grid". |
k_neighbors | int | 6 | Number of neighbors for KNN graph. |
radius | float or None | None | Radius for radius-based graph (required when spatial_method="radius"). |
max_iter | int | 100 | Maximum BCD solver iterations. |
tol | float | 1e-4 | Convergence tolerance (relative change in beta). |
preprocess | str | "log_cpm" | Preprocessing: "log_cpm", "pearson", or "raw". |
random_state | int or None | 0 | Random seed for reproducibility. |
verbose | bool | False | Whether to print progress. |
Methods
fit(Y, X, coords, cell_type_names=None)
Fit the deconvolution model.
| Parameter | Type | Description |
|---|---|---|
Y | ndarray or sparse (N, G) | Spatial transcriptomics count matrix. |
X | ndarray (K, G) | Reference cell type signature matrix. |
coords | ndarray (N, 2) or (N, 3) | Spatial coordinates. |
cell_type_names | ndarray (K,), optional | Cell type names. |
Returns self.
fit_transform(Y, X, coords, **kwargs)
Fit and return cell type proportions. Same parameters as fit(). Returns ndarray of shape (N, K).
get_cell_type_proportions() — Return normalized proportions (N, K).
get_abundances() — Return raw (unnormalized) abundances (N, K).
get_dominant_cell_type() — Return index of dominant cell type per spot (N,).
summary() — Return dict with model parameters and fit statistics.
compute_uncertainty(alpha=0.05)
Analytical uncertainty via Hessian-diagonal Laplace approximation. Returns dict with keys: entropy, residual_ss, residual_norm, var_prop, ci_lower, ci_upper, ci_half_width, cv, detection_confident, mean_ci_width.
bootstrap_uncertainty(n_bootstrap=100, max_iter_boot=20, seed=42, verbose=False)
Poisson parametric bootstrap for empirical confidence intervals. Returns dict with keys: boot_mean, boot_std, boot_ci_lower, boot_ci_upper, boot_cv, n_bootstrap.
Attributes (after fitting)
| Attribute | Type | Description |
|---|---|---|
proportions_ | ndarray (N, K) | Cell type proportions (sum to 1 per spot). |
beta_ | ndarray (N, K) | Raw (unnormalized) cell type abundances. |
gene_idx_ | ndarray | Indices of genes used for deconvolution. |
lambda_used_ | float | Actual lambda value used (relevant when lambda_spatial="auto"). |
info_ | dict | Optimization info: converged, n_iterations, final_objective. |
flashdeconv.tl.deconvolve
Scanpy-style entry point. Runs deconvolution and stores results in adata_st.
fd.tl.deconvolve(
    adata_st, adata_ref,
    cell_type_key="cell_type",
    *,
    sketch_dim=512, lambda_spatial="auto", rho_sparsity=0.01,
    n_hvg=2000, n_markers_per_type=50,
    spatial_method="knn", k_neighbors=6, radius=None,
    preprocess="log_cpm",
    layer_st=None, layer_ref=None,
    spatial_key="spatial", key_added="flashdeconv",
    random_state=0, copy=False,
)
| Parameter | Type | Default | Description |
|---|---|---|---|
adata_st | AnnData | — | Spatial transcriptomics data with coordinates in .obsm[spatial_key]. |
adata_ref | AnnData | — | Single-cell reference with cell type labels in .obs[cell_type_key]. |
cell_type_key | str | "cell_type" | Column in adata_ref.obs for cell type annotations. |
layer_st | str or None | None | Layer in adata_st to use. Uses .X if None. |
layer_ref | str or None | None | Layer in adata_ref to use. Uses .X if None. |
spatial_key | str | "spatial" | Key in adata_st.obsm for spatial coordinates. |
key_added | str | "flashdeconv" | Key for storing results. |
copy | bool | False | If True, return a copy instead of modifying in-place. |
All other parameters (sketch_dim, lambda_spatial, etc.) are forwarded to FlashDeconv — see constructor parameters.
Stores in adata_st:
.obsm[key_added]— DataFrame of cell type proportions (N x K).obs[f"{key_added}_dominant"]— Dominant cell type per spot (Categorical).uns[f"{key_added}_params"]— Parameters used for deconvolution
flashdeconv.io
I/O utilities for loading data from AnnData objects.
load_spatial_data(adata, layer=None, coord_key="spatial")
Extract count matrix, coordinates, and gene names from a spatial AnnData object. Looks for coordinates in adata.obsm[coord_key], then adata.obsm["X_spatial"], then adata.obs[["x", "y"]].
| Parameter | Type | Default | Description |
|---|---|---|---|
adata | AnnData | — | Spatial transcriptomics AnnData. |
layer | str or None | None | Layer to use for counts. Uses .X if None. |
coord_key | str | "spatial" | Key in adata.obsm for coordinates. |
Returns (Y, coords, gene_names).
load_reference(adata_ref, cell_type_key="cell_type", layer=None, method="mean")
Aggregate single-cell reference into cell type signatures.
| Parameter | Type | Default | Description |
|---|---|---|---|
adata_ref | AnnData | — | Single-cell reference AnnData. |
cell_type_key | str | "cell_type" | Column in adata_ref.obs for cell type labels. |
layer | str or None | None | Layer to use. Uses .X if None. |
method | str | "mean" | Aggregation method: "mean" or "sum". |
Returns (X, cell_type_names, gene_names).
align_genes(Y, X, genes_spatial, genes_ref)
Intersect and align genes between spatial and reference data. Returns (Y_aligned, X_aligned, common_genes).
prepare_data(adata_st, adata_ref, cell_type_key="cell_type", spatial_coord_key="spatial", layer_st=None, layer_ref=None)
Convenience wrapper combining load_spatial_data, load_reference, and align_genes. Returns (Y, X, coords, cell_type_names, gene_names).
result_to_anndata(beta, adata, cell_type_names=None, key_added="flashdeconv")
Store deconvolution results in AnnData. Adds .obsm[key_added] (DataFrame) and .obs[f"{key_added}_dominant"] (Categorical).
flashdeconv.utils
Graph construction and evaluation metrics.
Graph construction
build_knn_graph(coords, k=6, include_self=False)
Build k-nearest neighbor spatial graph from coordinates.
| Parameter | Type | Default | Description |
|---|---|---|---|
coords | ndarray (N, 2) or (N, 3) | — | Spatial coordinates. |
k | int | 6 | Number of nearest neighbors. |
include_self | bool | False | Whether to include self-loops. |
Returns scipy.sparse.csr_matrix (N, N) binary adjacency matrix.
build_radius_graph(coords, radius, include_self=False)
Build radius-based neighbor graph. Parameters same as build_knn_graph except radius: float replaces k.
coords_to_adjacency(coords, method="knn", k=6, radius=None)
Convert coordinates to adjacency matrix. Dispatches to build_knn_graph, build_radius_graph, or grid-based construction depending on method.
Evaluation metrics
All evaluation functions take pred and true as ndarray of shape (N, K).
compute_rmse(pred, true, per_cell_type=False) — Root mean squared error. Returns float or ndarray (K,) if per_cell_type=True.
compute_mae(pred, true, per_cell_type=False) — Mean absolute error. Returns float or ndarray (K,).
compute_correlation(pred, true, method="pearson", per_cell_type=False) — Pearson or Spearman correlation. Returns float or ndarray (K,).
compute_jsd(pred, true, epsilon=1e-10) — Jensen-Shannon divergence per spot. Returns ndarray (N,).
evaluate_deconvolution(pred, true, cell_type_names=None) — Comprehensive evaluation returning a dict with overall metrics (RMSE, MAE, Pearson, Spearman, mean JSD) and per_cell_type breakdown.
Input Formats
- Spatial data: AnnData, NumPy array (N × G), or SciPy sparse matrix
- Reference: AnnData (aggregated by cell type) or NumPy array (K × G)
- Coordinates: Extracted from
adata.obsm["spatial"]or NumPy array (N × 2)
Reference Quality
Deconvolution accuracy depends on reference quality:
| Requirement | Guideline |
|---|---|
| Cells per type | ≥ 500 recommended |
| Marker fold-change | ≥ 5× for distinguishability |
| Signature correlation | < 0.95 between types |
| No Unknown cells | Filter before deconvolution |
Critical: Always remove cells labeled "Unknown", "Unassigned", or similar. These cells act as universal signatures that absorb proportions from specific types—a fundamental property of regression-based deconvolution, not a FlashDeconv limitation.
See Reference Data Guide for details.
Installation Options
# Standard
pip install flashdeconv

# With AnnData support
pip install flashdeconv[io]

# Development
git clone https://github.com/cafferychen777/flashdeconv.git
cd flashdeconv && pip install -e ".[dev]"
Requirements: Python ≥ 3.9, numpy, scipy, numba. Optional: scanpy, anndata.
Citation
If you use FlashDeconv in your research, please cite:
Yang, C., Zhang, X. & Chen, J. FlashDeconv enables atlas-scale, multi-resolution spatial deconvolution via structure-preserving sketching. bioRxiv (2025). DOI: 10.64898/2025.12.22.696108
@article{yang2025flashdeconv,
  title={FlashDeconv enables atlas-scale, multi-resolution spatial deconvolution
         via structure-preserving sketching},
  author={Yang, Chen and Zhang, Xianyang and Chen, Jun},
  journal={bioRxiv},
  year={2025},
  doi={10.64898/2025.12.22.696108}
}
Resources
- Paper reproducibility code
- Reference data guide — Building quality reference signatures
- Stereo-seq guide — Platform-specific considerations
- GitHub Issues
- BSD-3-Clause License
Acknowledgments
We thank the developers of Spotless, Cell2Location, RCTD, CARD, and other deconvolution methods whose work contributed to this field.