Summary
March 10, 2026 · View on GitHub
The main objective for the Enso engine (e.g. the backend of the Enso GUI) is to deliver satisfactory user experience when using Enso via the GUI. When operations get sluggish, we need tools to analyze what's going on.
Use JVM Mode
A major obstacle to understanding performance since the 2025.3 version is the
Dual JVM mode. While beneficial to overall
system performance, it also complicates the analysis of performance issues.
The heterogeneous nature of the Enso process requires different techniques to
profile the native image part and different to profile the HotSpot JVM part.
That may become quite complicated. To simplify this task it is recommended to
start analysis in JVM only mode - e.g. by passing --jvm flag to the enso
executable, by specifying jvm: true in project's package.yaml file or by
other means.
Luckily most of the problems are generic enough to manifest themselves in all the modes Enso is able to operate in. Hence the first recommended step is to check the JVM Only mode. Only when the issue is clearly Dual JVM specific, resort to more advanced techniques.
Analyze with VisualVM
GraalVM, Truffle and the JVM performance overall can be greatly analyzed by VisualVM - download from its website. Enso (because of building on top of Truffle) is well integrated with VisualVM's heap analysis as well as polyglot sampler (more below). Enso offers various tools that make integration with VisualVM even better.
Sampling
VisualVM offers polyglot sampler. To use it one has to execute enso in
JVM Only mode and also open up access to org.graalvm.polyglot module - as
the sampler needs to connect to the HotSpot JVM and find out all existing
Engine instances. To do so one has to modify the
launching instructions a bit:
enso$ ENSO_ENGINE_ARGS=--jvm \
    JAVA_TOOL_OPTIONS=--add-opens=org.graalvm.polyglot/org.graalvm.polyglot=ALL-UNNAMED \
    corepack pnpm run dev:gui
Specifying ENSO_ENGINE_ARGS forces the JVM Only mode and JAVA_TOOL_OPTIONS
provides access to the org.graalvm.polyglot module internals. Now open a
project, start VisualVM and attach to the Java process:
Once connected, start the polyglot CPU sampler and then modify something in the GUI. Each code modification results in an execution of the Enso code. The sampler slowly collects the profiling info and presents the results for manual inspection:
Startup
Getting quickly ready to work is essential for good user experience. There have been tremendous improvements over the last few years especially due to compilation of Enso core into native executable - more details in a Launching Enso Instantly discussion. Running Enso as a native image removed all the HotSpot JVM initialization overhead.
However that doesn't mean there are not inefficiencies in the Enso code itself. To analyze them it is still useful to run in JVM only mode. Thus let this document describe how to measure, record and analyze the startup of the Enso engine in JVM only mode.
Collecting the data via the runner
Runner executable also supports so called self profiling with the
--profiling-path option. For example the
launching instructions can be modified to run
with the profiling enabled:
enso$ ENSO_ENGINE_ARGS="--jvm --profiling-path /tmp/run.npss" corepack pnpm run dev:gui
Open a project, work with it, then close it. The /tmp/run.npss file is
generated together with a sibling /tmp/run.log file. They can be both opened
in VisualVM with following command:
$ visualvm --openfile /tmp/run.npss
Unlike the polyglot sampler this profiling works on the level of Java methods and classes. It is not suitable for analyzing the behavior of Enso code, only the supporting Java code.
Interactively Analyze
VisualVM offers two timelines. A "stackdepth" one and also "UI Actions" line.
Hovering over boxes in "UI Actions" shows the messages describing what happens
in the engine - what has been logged into start.log. One can then select an
interval and get profiling information for that interval:
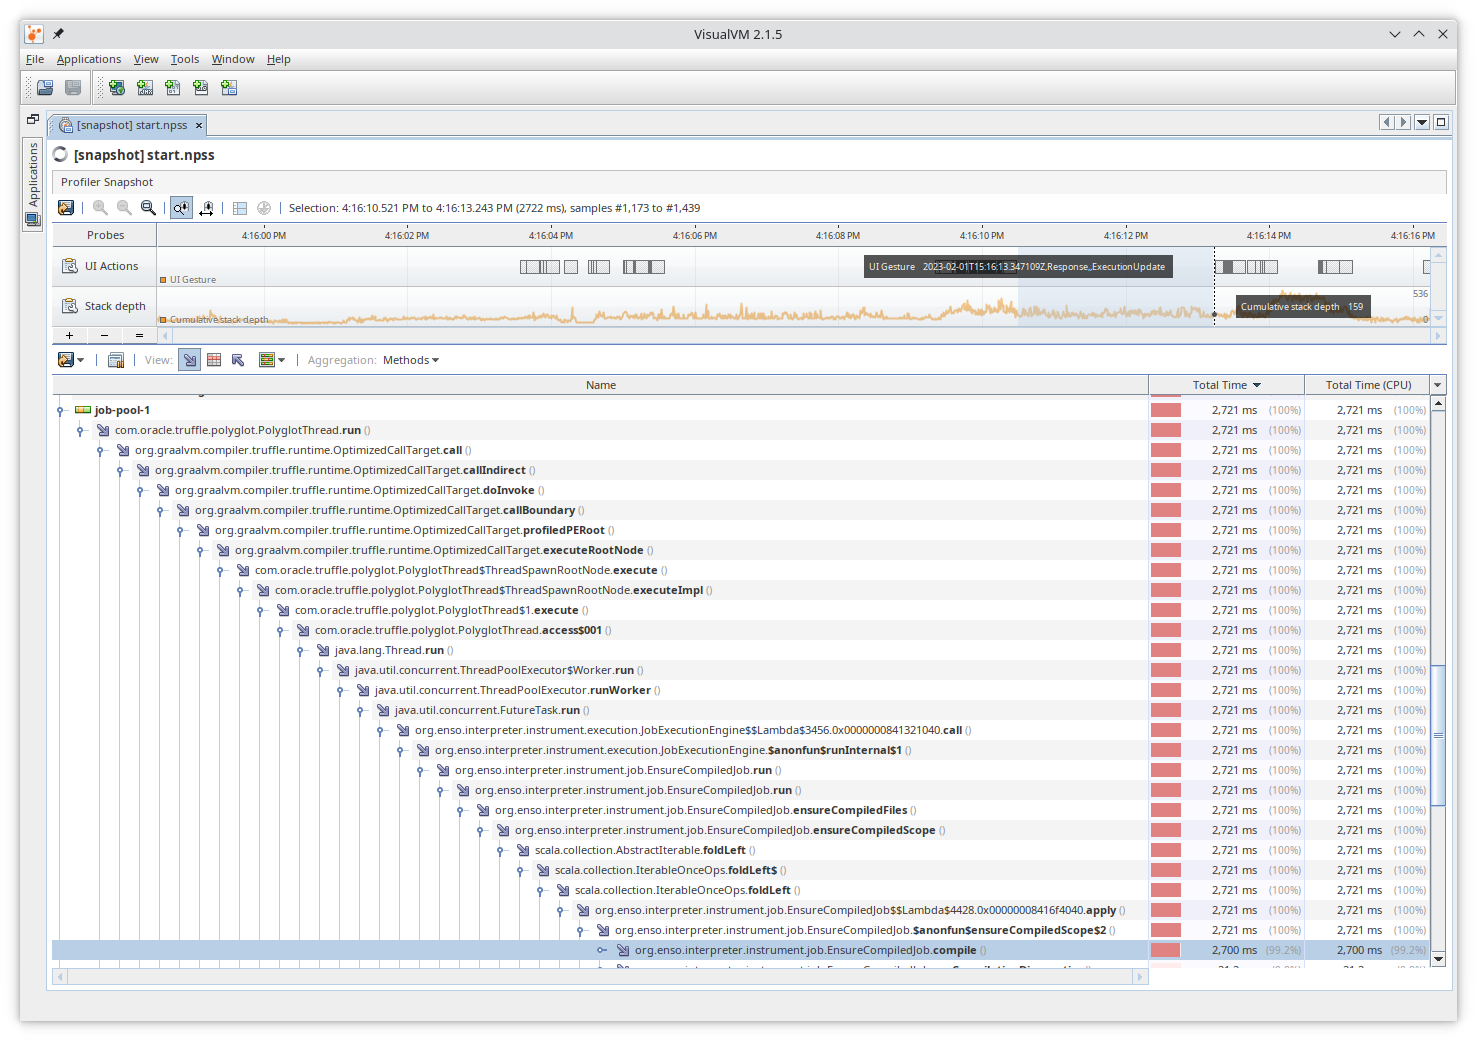
This picture shows that 2.7s is spend in EnsoCompiledJob task. Overall the
goal is to log enough information to help us navigate thru the long startup
sequence. Select appropriate interval based on the displayed UI Actions - e.g.
logged events - and analyze what has happened there based on the sampling of JVM
stack traces.