Server Administration
June 7, 2020 · View on GitHub
You can administrate and manage the server via a set of web-pages or via a REST API.
By default, the server listens on HTTP port 8080 and expects "admin" as both username and password.
You can access it via a web browser by entering the URL http://server:8080, where
server is the IP or the hostname of your server.
The port and default credentials (which are set when the server database is created)
can be changed in the sys.config. The credentials can
be then altered via the admin interface.
The server administration can be operated in an isolated network, except (Google) graphs displayed in the Web Admin. Without internet connectivity the graphs will not be displayed, but other Web Admin functions and the REST API will work fine.
Web Admin
The management web-pages are available under /admin. It is a wrapper around
the REST API described below.
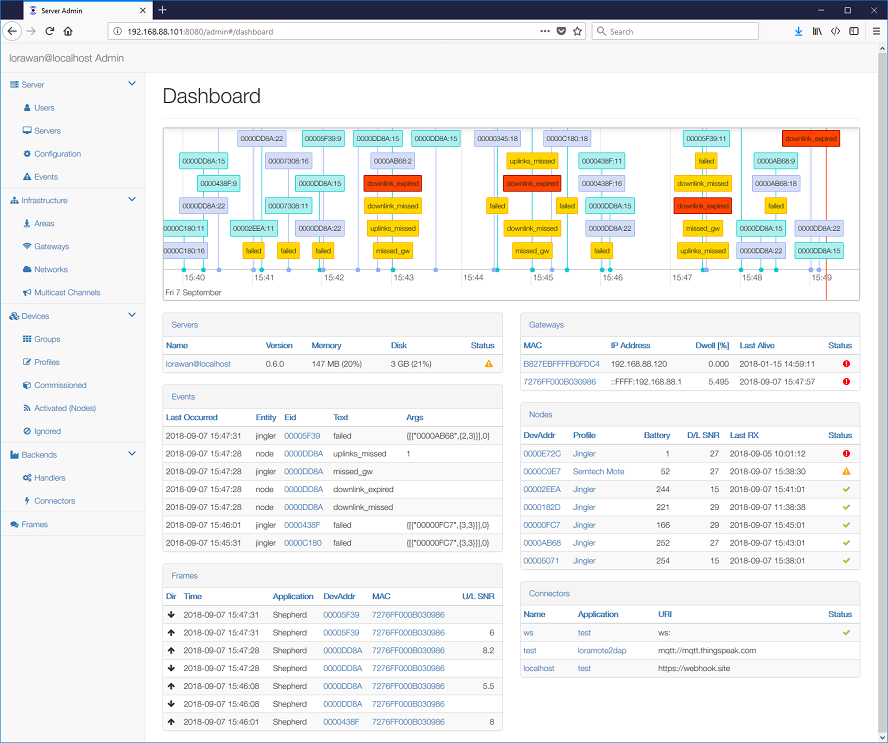
The server Dashboard shows:
- Rolling timeline that displays:
- Server information and a list of Gateways, and Nodes that may need your attention. The lines are sorted by severity.
- Seven most recent Events and seven most recent frames received.
Note on Events
- 'too_late' events come from the packet_forwarder and means the packet arrived to late to be programmed into concentrator.
- 'too_early' events come from the packet_forwarder and means the packet is programmed too early in time, however because of an overflow it can mean 'too_late' as well, see this issue.
The following configuration pages are available:
- Server enables configuration and monitoring and also Cluster management.
- Infrastructure covers configuration of LoRa Gateways, Networks and Multicast Channels.
- Devices cover the entire device configuration:
- Commissioned contain a list of devices that are allowed to join using the over-the-air-activation (OTAA).
- Activated Nodes contain a list of active network nodes, both activated by personalization (ABP) as well as those that joined as OTAA.
- Backends define applications at remote servers that shall receive the frames:
- Handlers define the LoRaWAN frame structure and data fields included.
- Connectors define the communication protocol to the backend servers.
The server Configuration Guidelines describe the configuration required to operate the server.
Health Monitoring
Health of servers, gateways, (activated) nodes and connectors is automatically monitored. For each item the server evaluates a set of static rules and calculates a decay. The decay Alerts are displayed on the respective web-admin pages and the server Dashboard displays the most decayed items that deserve operator attention.
When an item decay gets worse the server can notify responsible operators via e-mail or Slack.
To enable Slack notifications:
- Manage apps of your Slack account, go to Custom Integrations -- Bots, then Add Configuration of a new Bot and remember its API Token.
- Invite your Bot to the desired Slack Channel(s).
- Set the Slack API Token of your Bot to the Server Configuration.
- Set the Slack Channel for the desired Areas and/or Groups; you can use a dedicated channel for each, or a common channel for all.
To enable E-Mail notifications:
- Set the E-mail server address and credentials in the Server Configuration.
- Review the desired Users, set their E-Mail addresses and enable the server to Send Alerts.
- For the desired Areas and/or Groups set the Admins that shall receive the notifications.
Prometheus Support
Server performance may also be monitored with standard statistic gathering tools like Prometheus and Grafana.
To enable Prometheus support, add or uncomment the following line in your server's configuration file (See Configuration Guidelines for details):
[{lorawan_server, [
    ...
    % Set the following parameter to true to export statistics metrics in Prometheus format
    {enable_prometheus, true},
    ...
 ]},
 ...
]
Once enabled, the metrics information will be exported at http(s)://your.server:port/metrics
endpoint. The information exported will consist of all the available metrics supported
by Prometheus client for Erlang and
Prometheus support for Cowboy modules,
including Cowboy, Erlang VM and Mnesia database, apart from the LoRaWAN server specific
metrics prefixed with lorawan_ designator. To get a finer control over what types of
information get exported in the metrics, please consult the documents at the links above.
REST API
The following REST resources are made available:
| Resource | Methods | Explanation |
|---|---|---|
| /api/config/main | GET, PUT | Central server configuration |
| /api/servers | GET | Server status information |
| /api/applications | GET | Supported LoRaWAN applications |
| /api/users | GET, POST | Users of the admin interface |
| /api/users/ABC | GET, PUT, DELETE | User ABC |
| /api/areas | GET, POST | Administrative groups of gateways |
| /api/areas/ABC | GET, PUT, DELETE | Area ABC |
| /api/gateways | GET, POST | LoRaWAN gateways |
| /api/gateways/123 | GET, PUT, DELETE | Gateway with MAC=123 |
| /api/multicast_channels | GET, POST | Class C multicast channels |
| /api/multicast_channels/123 | GET, PUT, DELETE | Multicast channel with DevAddr=123 |
| /api/networks | GET, POST | Network and regional settings |
| /api/networks/ABC | GET, PUT, DELETE | Network ABC |
| /api/groups | GET, POST | Administrative groups of profiles |
| /api/groups/ABC | GET, PUT, DELETE | Group ABC |
| /api/profiles | GET, POST | Device profiles |
| /api/profiles/ABC | GET, PUT, DELETE | Device profile ABC |
| /api/devices | GET, POST | Devices commissioned for over-the-air activation (OTAA) |
| /api/devices/123 | GET, PUT, DELETE | Commissioned device with DevEUI=123 |
| /api/nodes | GET, POST | Active network nodes, both ABP and activated OTAA |
| /api/nodes/123 | GET, PUT, DELETE | Active network node with DevAddr=123 |
| /api/ignored_nodes | GET, POST | Nodes ignored by the server |
| /api/ignored_nodes/123 | GET, PUT, DELETE | Ignored node with DevAddr=123 |
| /api/queued | GET | Frames queued for transmission |
| /api/queued/123 | GET, DELETE | Queued frame with ID=123 |
| /api/rxframes | GET | Recent received frames |
| /api/handlers | GET | Backend handlers |
| /api/handlers/ABC | GET, DELETE | Backend handler for the Group ABC |
| /api/connectors | GET | Backend connectors |
| /api/connectors/ABC | GET, DELETE | Backend connector ABC |
| /api/events | GET | Recent errors and warnings |
| /api/upload | PUT | Uploads (certificate) files to the server |
There is a 1:1 mapping between the REST API and the Web Admin. Parameters that are in the Web Admin indicated as optional doesn't need to be provided in the REST API either.
As a rule, POST should be used to create new entries and PUT should be used to update existing entries.
For example:
Get a list of all users by:
GET /api/users HTTP/1.1
HTTP/1.1 200 OK
Content-Type: application/json

[{"name":"admin","pass":"admin"},{"name":"backup","pass":"backup"}]
Create or update a set of users by:
POST /api/users HTTP/1.1
Content-Type: application/json

[{"name":"admin","pass":"admin"},{"name":"backup","pass":"backup"}]
HTTP/1.1 204 No Content
Get one user by:
GET /api/users/backup HTTP/1.1
HTTP/1.1 200 OK
Content-Type: application/json

{"name":"backup","pass":"backup"}
Update one user by:
PUT /api/users/backup HTTP/1.1
Content-Type: application/json

{"name":"backup","pass":"backup"}
HTTP/1.1 204 No Content
Delete one user by:
DELETE /api/users/backup HTTP/1.1
HTTP/1.1 204 No Content
This enables users to create simple script for auto-configuration. For example, to add a new Device programmatically you can do:
#!/usr/bin/env python
import requests
from requests.auth import HTTPDigestAuth
payload = [{'devaddr': '00000000', 'profile':'Semtech Mote',
    'nwkskey':'00000000000000000000000000000000', 'appskey':'00000000000000000000000000000000', 'fcntdown':0}]
print requests.post("http://localhost:8080/api/nodes", json=payload, auth=HTTPDigestAuth('admin', 'admin'))
Filtering
To list only some items the REST API accepts the _filters query parameter, which
shall contain URL encoded JSON. For instance:
http://server:8080/api/rxframes?_filters={"devaddr":"22222222"}
Sorting
The REST API accepts _sortField and _sortDir query parameters to sort the list. The
_sortDir can be either ASC or DESC. For instance:
http://server:8080/api/rxframes?_sortField=datetime&_sortDir=ASC
Pagination
The REST API accepts _page and _perPage query parameters to paginate lists,
for instance:
http://server:8080/api/rxframes?_page=2&_perPage=20
The server also inserts the HTTP header X-Total-Count indicating the total item count.
Proxy Configuration
When the lorawan-server is installed behind a HTTP proxy you may need to adjust the proxy configuration as follows.
Apache HTTP
<VirtualHost *:80>
    ProxyPass        /ws  ws://localhost:8080/ws
    ProxyPass        /    http://localhost:8080/
    ProxyPassReverse /    http://localhost:8080/
    ProxyPreserveHost On
    ServerName lorawan.example.com
</VirtualHost>
Backup and Restore
Use the bin/dbexport script to backup your database. This will create a backup-xxx
directory with several *.json files. Use the bin/dbimport backup-xxx script to
write these files back to the server database.
The database is stored in the Mnesia.lorawan@localhost directory. To upgrade
the database structure or recover from database errors you should do dbexport,
then shutdown the server, update the server binaries, delete the Mnesia directory,
start the server and do dbimport.