MoniGo - Runtime Observability for Go Applications
August 29, 2026 · View on GitHub

MoniGo - Runtime Observability for Go Applications




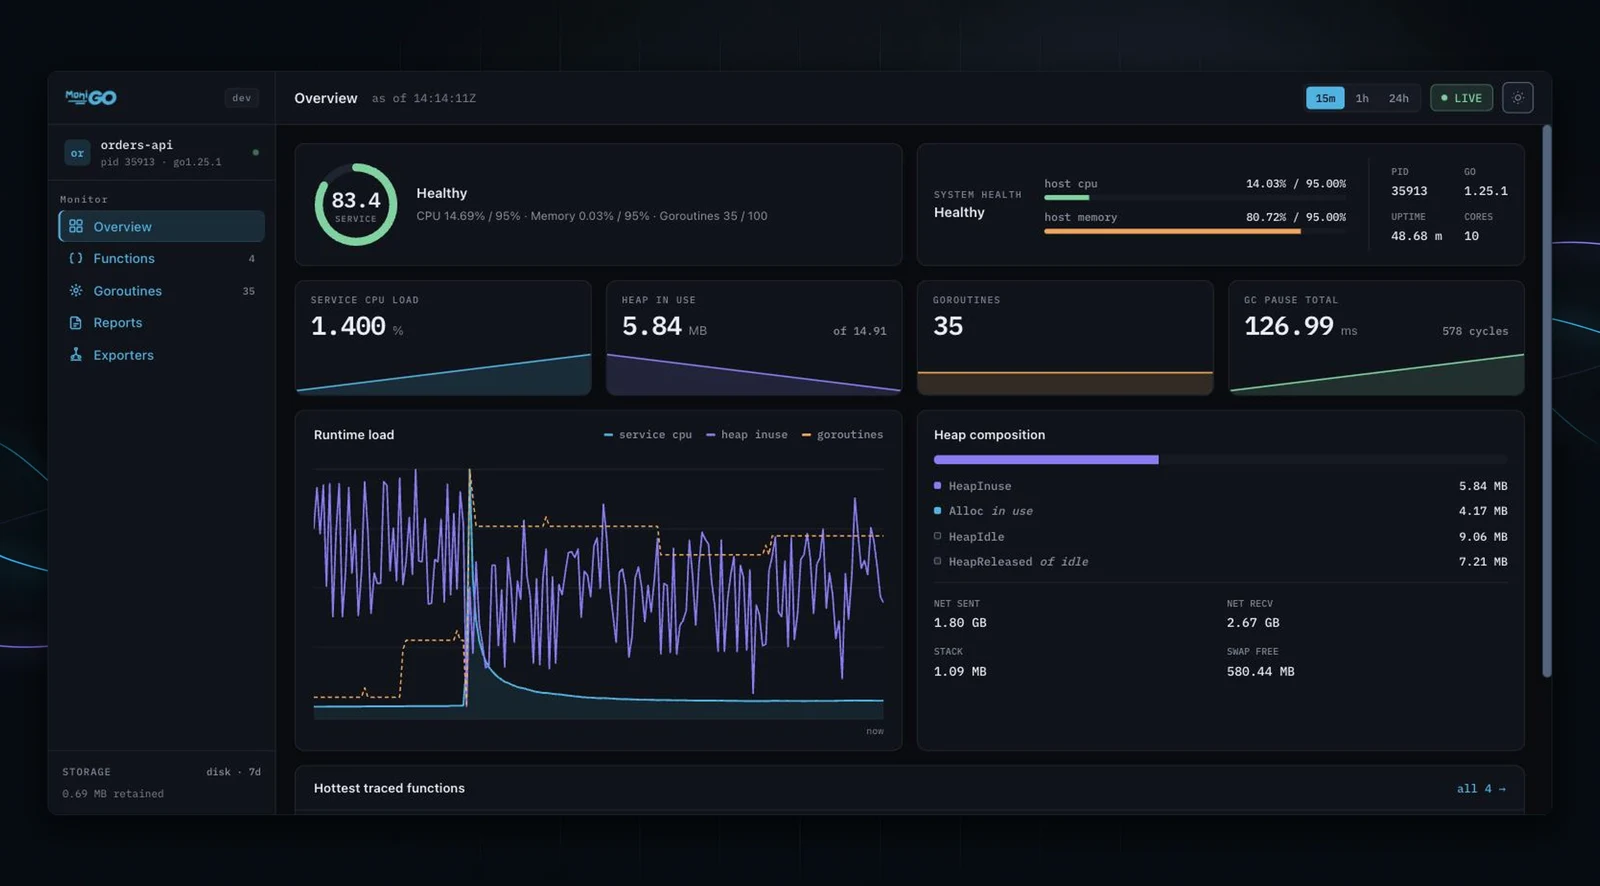
MoniGo is a lightweight, embeddable observability library for Go services. It collects runtime metrics (CPU, memory, goroutines, disk/network I/O), traces function execution with pprof profiling, stores time-series data, and serves a real-time dashboard - all from a single go get.
Features
- Function-Level Tracing - Profile any function with CPU/memory pprof, adaptive sampling, and reflection-based argument capture
- Pluggable Storage - Persistent disk (tstorage) or volatile in-memory backends
- Real-Time Dashboard - Embedded web UI with system metrics, health scoring, goroutine inspection, and downloadable reports
- Prometheus & OpenTelemetry - Built-in
/metricsendpoint and OTLP/gRPC export - Router Integration - Works with
net/http, Gin, Echo, Chi, Fiber, Gorilla Mux - Dashboard Security - Basic Auth, API Key, IP Whitelist, Rate Limiting middleware
- Headless Mode - Run as a background telemetry agent without the dashboard
- Builder API - Type-safe, chainable configuration with validation
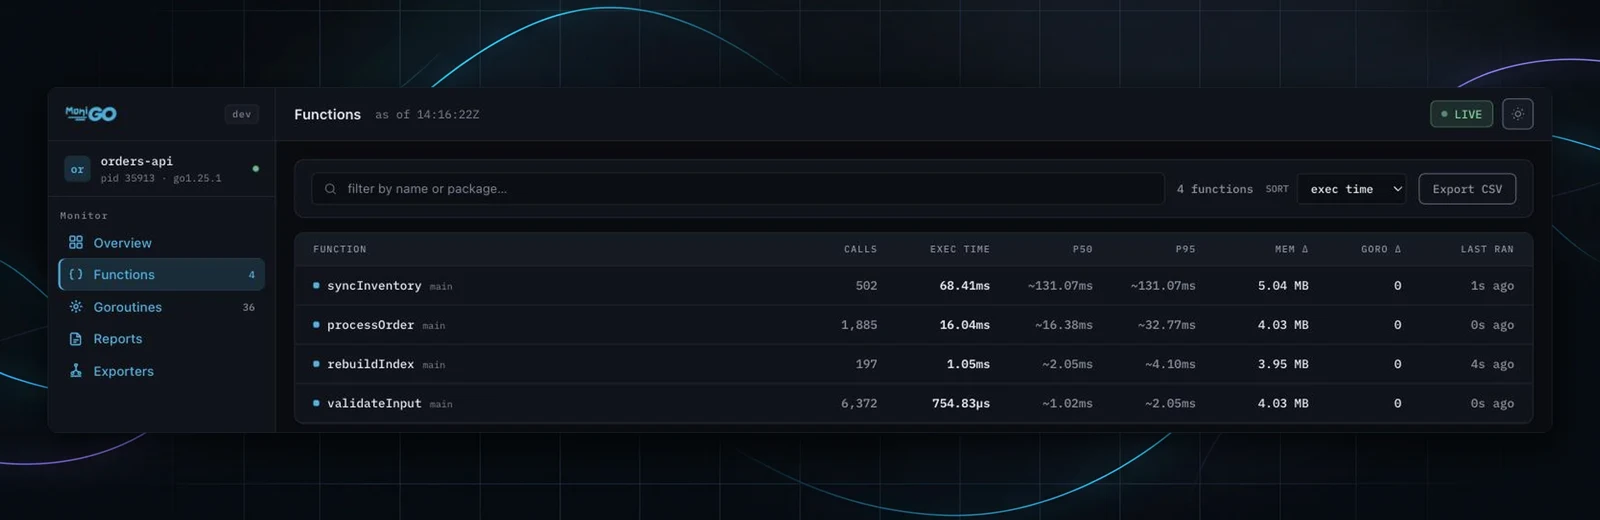
Per-function metrics
Call counts and approximate latency percentiles for every traced function, with
memory and goroutine deltas. Percentiles are bucket upper bounds, shown as ~4ms
meaning "at most 4ms", and read - below 20 calls rather than pretending three
samples make a p95.
Goroutine inspection
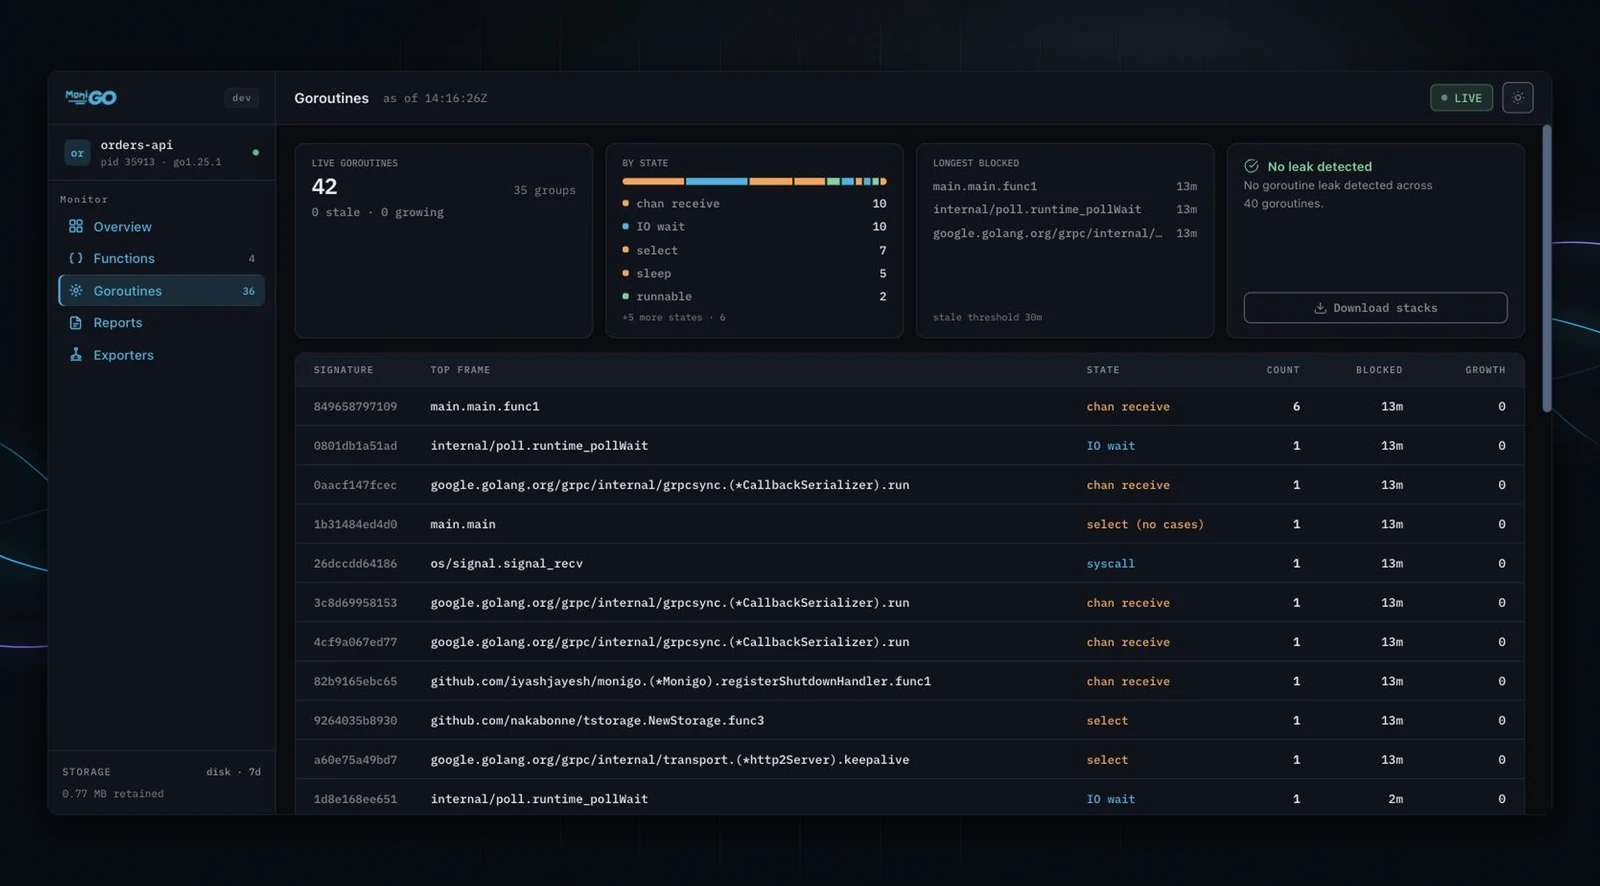
Live goroutines grouped by stack signature, with state, how long each group has been blocked, and growth across snapshots -- so a leak shows up as a group that keeps growing rather than a number that keeps rising.
Exporter status
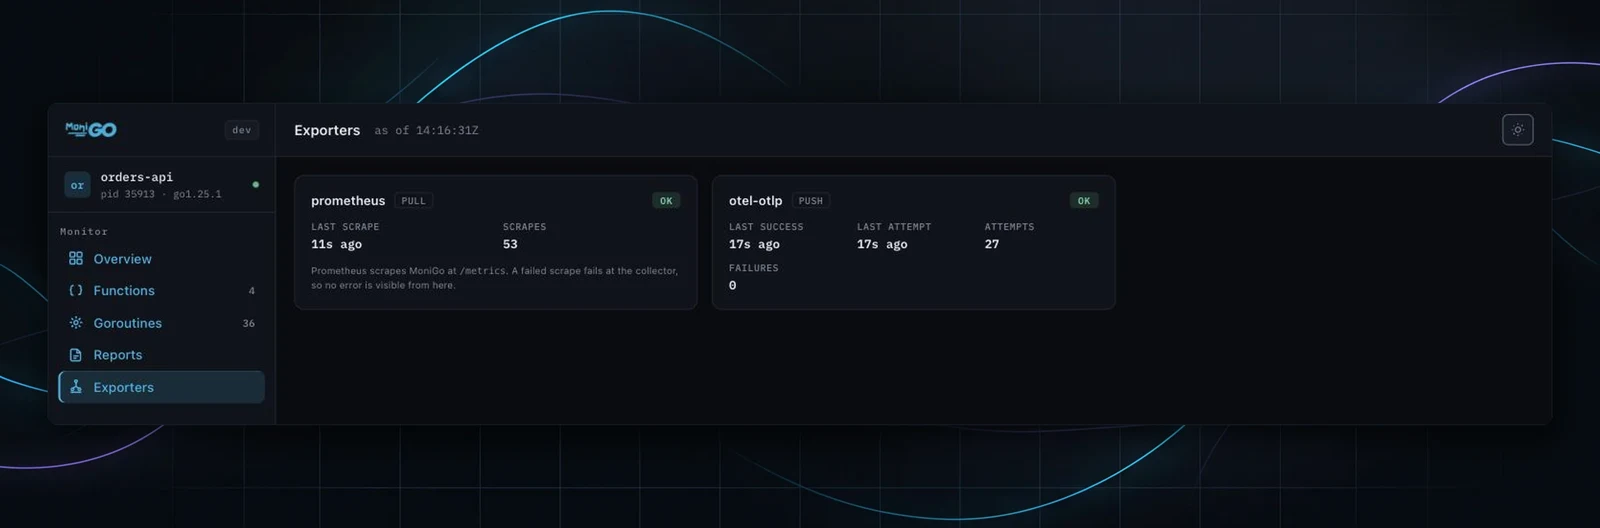
Prometheus and OpenTelemetry reported in their own terms. MoniGo is scraped by Prometheus and pushes to OTel, so the pull exporter shows when it was last scraped and carries no failure count -- a failed scrape fails at the collector, and the server never hears about it.
Installation
go get github.com/iyashjayesh/monigo@latest
Requires Go 1.22+.
Quick Start
package main

import (
    "log"
    "math"
    "net/http"

    "github.com/iyashjayesh/monigo"
)

func main() {
    m := monigo.NewBuilder().
        WithServiceName("my-api").
        WithPort(8080).
        WithStorageType("memory").
        WithSamplingRate(100).
        Build()

    go func() {
        if err := m.Start(); err != nil {
            log.Fatalf("monigo: %v", err)
        }
    }()

    http.HandleFunc("/compute", func(w http.ResponseWriter, r *http.Request) {
        monigo.TraceFunction(r.Context(), heavyWork)
        w.Write([]byte("done"))
    })

    log.Fatal(http.ListenAndServe(":9000", nil))
}

func heavyWork() {
    var sum float64
    for i := 0; i < 1e8; i++ {
        sum += math.Sqrt(float64(i))
    }
}
Dashboard: http://localhost:8080 - Your app: http://localhost:9000
Configuration
All configuration is done via the builder pattern:
m := monigo.NewBuilder().
    WithServiceName("order-service").       // Required
    WithPort(8080).                         // Dashboard port (default: 8080)
    WithStorageType("disk").                // "disk" or "memory" (default: "disk")
    WithRetentionPeriod("7d").              // Data retention (default: "7d")
    WithDataPointsSyncFrequency("5m").      // Metric flush interval (default: "5m")
    WithSamplingRate(100).                  // Trace 1 in N calls (default: 100)
    WithMaxCPUUsage(90).                    // Health threshold (default: 95%)
    WithMaxMemoryUsage(90).                 // Health threshold (default: 95%)
    WithMaxGoRoutines(500).                 // Health threshold (default: 100)
    WithAlertWebhook("https://...").        // Health breach webhook (default: off)
    WithStaleGoroutineThreshold(24*time.Hour). // Stale goroutine cutoff (default: 24h)
    WithHeadless(false).                    // true = no dashboard (default: false)
    WithTimeZone("UTC").                    // Timezone (default: "Local")
    WithLogLevel(slog.LevelInfo).           // Log level
    WithOTelEndpoint("localhost:4317").      // OTLP gRPC endpoint
    WithOTelHeaders(map[string]string{      // OTel auth headers
        "Authorization": "Bearer <token>",
    }).
    Build()
Health Breach Alerts
MoniGo computes a system and service health score on every collection cycle. Point
WithAlertWebhook at an HTTP endpoint to be notified when either score drops below
70. Left unset, MoniGo makes no outbound requests.
m := monigo.NewBuilder().
    WithServiceName("order-service").
    WithAlertWebhook("https://hooks.slack.com/services/...").
    Build()
Delivery is POST with Content-Type: application/json:
{
  "service_name": "order-service",
  "timestamp": "2026-08-28T11:59:20Z",
  "message": "Service Health Alert: Service usage exceeds allowed limits: CPU Usage 143.20% / 95.00%, ...",
  "health_score": 42.5
}
Alerts are dispatched off the metrics collection path, so a slow or unreachable endpoint never stalls metric collection. Requests time out after 10 seconds, and a minimum of 5 minutes separates deliveries so a flapping service cannot emit an alert on every tick. Delivery failures are logged and otherwise ignored.
Build() rejects a webhook URL that is not http:// or https://.
Goroutine Leak Detection
Every metrics collection cycle captures all goroutine stacks and evaluates them for
two independent leak signals. The verdict appears on the Go Routines Stats page and
in the go-routines-stats API response, and raises the alert webhook if one is
configured.
Stale goroutines. The Go runtime stamps a block duration into each goroutine's stack header once it has been parked for over a minute:
goroutine 21 [chan receive, 47 minutes]:
Any goroutine blocked at or beyond the threshold is reported as stale. The default
is 24h; WithStaleGoroutineThreshold takes any duration of 1m or more (below that
is not representable, since the runtime reports whole minutes only).
Growing call stacks. Goroutines are grouped by identical call stack, and the per-group counts are retained across the last 5 collection cycles. A group is flagged only if its count rose in every retained cycle. That rule is deliberately strict: a worker pool scaling up briefly, plateauing, or oscillating is not a leak, and a group absent from the oldest snapshot is treated as new rather than growing. Nothing is reported until the window is full, so a freshly started service cannot raise a false alarm from two data points.
m := monigo.NewBuilder().
    WithServiceName("order-service").
    WithStaleGoroutineThreshold(6 * time.Hour).
    WithAlertWebhook("https://hooks.slack.com/services/...").
    Build()
The report is carried on the goroutine stats response:
{
  "number_of_goroutines": 456,
  "leak_report": {
    "total_goroutines": 456,
    "stale_goroutines": 443,
    "growing_groups": 1,
    "leak_suspected": true,
    "snapshots_retained": 5,
    "snapshots_required": 5,
    "stale_threshold_minutes": 360,
    "message": "Possible goroutine leak: 443 goroutine(s) blocked for at least 6h; 1 call stack(s) growing across the last 5 snapshots (total goroutines: 456).",
    "suspicious_groups": [
      {
        "signature": "a3f19c2d4e5b",
        "state": "chan receive",
        "count": 440,
        "blocked_minutes": 421,
        "growth": 100,
        "stale": true,
        "growing": true,
        "call_stack": "main.worker()\n\t/app/main.go:31 +0x24\n..."
      }
    ]
  }
}
Detection is driven by the metrics collection cycle rather than by dashboard polling, so growth snapshots stay evenly spaced and a leak is caught whether or not anyone has a browser tab open.
Function Tracing
// Simple function
monigo.TraceFunction(ctx, myFunc)

// Function with arguments
monigo.TraceFunctionWithArgs(ctx, processOrder, orderID, userID)

// Function with single return
result := monigo.TraceFunctionWithReturn(ctx, calculateTotal, items).(float64)

// Function with multiple returns
results := monigo.TraceFunctionWithReturns(ctx, validateInput, data)
val := results[0].(string)
err := results[1].(error)
Each traced call captures: execution time, memory delta, goroutine delta, and (at sampling rate) CPU/memory pprof profiles.
Dashboard Security
mw, stop := monigo.RateLimitMiddleware(100, time.Minute)
defer stop()

m := monigo.NewBuilder().
    WithServiceName("secure-api").
    WithPort(8080).
    WithDashboardMiddleware(
        monigo.BasicAuthMiddleware("admin", "s3cret"),
        mw,
    ).
    WithAPIMiddleware(
        monigo.APIKeyMiddleware("my-api-key"),
    ).
    Build()
Router Integration
MoniGo integrates with any Go HTTP router:
// Standard net/http
mux := http.NewServeMux()
monigo.RegisterDashboardHandlers(mux)

// Fiber
app.All("/monigo/*", adaptor.HTTPHandler(monigo.GetUnifiedHandler()))

// Gin / Echo / Chi - use GetAPIHandlers() map
for path, handler := range monigo.GetAPIHandlers() {
    router.GET(path, gin.WrapF(handler))
}
See example/router-integration/ for complete examples.
API Endpoints
| Method | Path | Description |
|---|---|---|
| GET | /monigo/api/v1/metrics | Current service statistics |
| GET | /monigo/api/v1/service-info | Service metadata |
| POST | /monigo/api/v1/service-metrics | Query time-series data |
| GET | /monigo/api/v1/go-routines-stats | Goroutine stack analysis |
| GET | /monigo/api/v1/function | Function trace summary |
| GET | /monigo/api/v1/function-details | pprof reports for a function |
| POST | /monigo/api/v1/reports | Aggregated report data |
| GET | /metrics | Prometheus scrape endpoint |
Architecture
┌─────────────────────────────────────────────────┐
│                  Your Application                │
│                                                  │
│  monigo.TraceFunction(ctx, fn)                   │
│  monigo.Start() / monigo.Initialize()            │
└───────────┬─────────────────────┬────────────────┘
            │                     │
    ┌───────▼───────┐    ┌───────▼────────┐
    │   core/       │    │   monigo.go    │
    │  Metrics      │    │  Dashboard     │
    │  Collection   │    │  HTTP Server   │
    │  Health Score │    │  Middleware     │
    │  Profiling    │    │  Router Integ. │
    └───────┬───────┘    └───────┬────────┘
            │                     │
    ┌───────▼─────────────────────▼────────┐
    │           timeseries/                 │
    │  tstorage (disk) │ InMemoryStorage   │
    └───────┬──────────────────────────────┘
            │
    ┌───────▼───────────────────────────────┐
    │           exporters/                   │
    │  Prometheus Collector │ OTel Exporter  │
    └───────────────────────────────────────┘
            │
    ┌───────▼───────────────────────────────┐
    │           internal/                    │
    │  registry │ pipeline │ exporter │ log  │
    └───────────────────────────────────────┘
Package responsibilities:
| Package | Role |
|---|---|
monigo (root) | Public API, dashboard server, middleware, builder |
core | System metric collection, function tracing, health scoring |
common | Utilities, unit conversion, process info |
timeseries | Storage abstraction (disk + in-memory) |
exporters | Prometheus collector, OTel OTLP exporter |
internal/registry | Thread-safe metric registry |
internal/pipeline | Async metric export pipeline |
internal/exporter | Exporter interface + fan-out |
internal/logger | Race-safe structured logger (slog) |
models | Shared data structures |
api | HTTP handlers for all endpoints |
What Works Well
- Zero-dependency embedding - Single
go get, no sidecar, no agent - Goroutine-safe metrics - Atomic sampling, mutex-protected maps,
sync.Oncesingletons - Adaptive profiling - Sampling prevents pprof overhead in hot paths
- Clean builder API - Validation at build time catches misconfiguration early
- Race-free logger -
atomic.Pointereliminates the commonslogdata race
Examples
| Example | Path |
|---|---|
| Basic usage | example/main.go |
| Function tracing | example/function-trace-example/ |
| Gin integration | example/router-integration/gin-integration/ |
| Echo integration | example/router-integration/echo-integration/ |
| Fiber integration | example/router-integration/fiber-integration/ |
| Standard mux | example/router-integration/standard-mux-integration/ |
| Gorilla mux | example/router-integration/gorilla-mux-integration/ |
| Basic auth | example/security-examples/basic-auth/ |
| API key auth | example/security-examples/api-key/ |
| IP whitelist | example/security-examples/ip-whitelist-example/ |
| Custom auth | example/security-examples/custom-auth/ |
Documentation
Full guides and API reference: iyashjayesh.github.io/monigo-website
| Topic | Link |
|---|---|
| Introduction & Features | Docs |
| Configuration (Builder API) | Docs |
| Function Tracing | Docs |
| Router Integration | Docs |
| Dashboard Security | Docs |
| Migration (v1 → v2) | Docs |
Contributing
We welcome contributions. Please see CONTRIBUTING.md for guidelines.
If you find MoniGo useful, consider giving it a star.
License
Apache 2.0 - see LICENSE.
Contact
For questions or feedback: open an issue or reach out at iyashjayesh@gmail.com / LinkedIn.