Developer manual
January 7, 2025 · View on GitHub
Setting up a local test cluster
The development setup is streamlined into three steps:
- Ensure the prerequisites are available:
- Create the kwok cluster and dependency services:
$ make kwok stack
- Compile and run the kelemetry all-in-one executable:
$ make
- Open http://localhost:16686 in your browser to view the trace output with Jaeger UI.
Extending Kelemetry
Component manager
The code architecture of Kelemetry uses component-oriented dependency injection. Dependency components are automatically enabled if any of its (transitive) dependents is enabled.
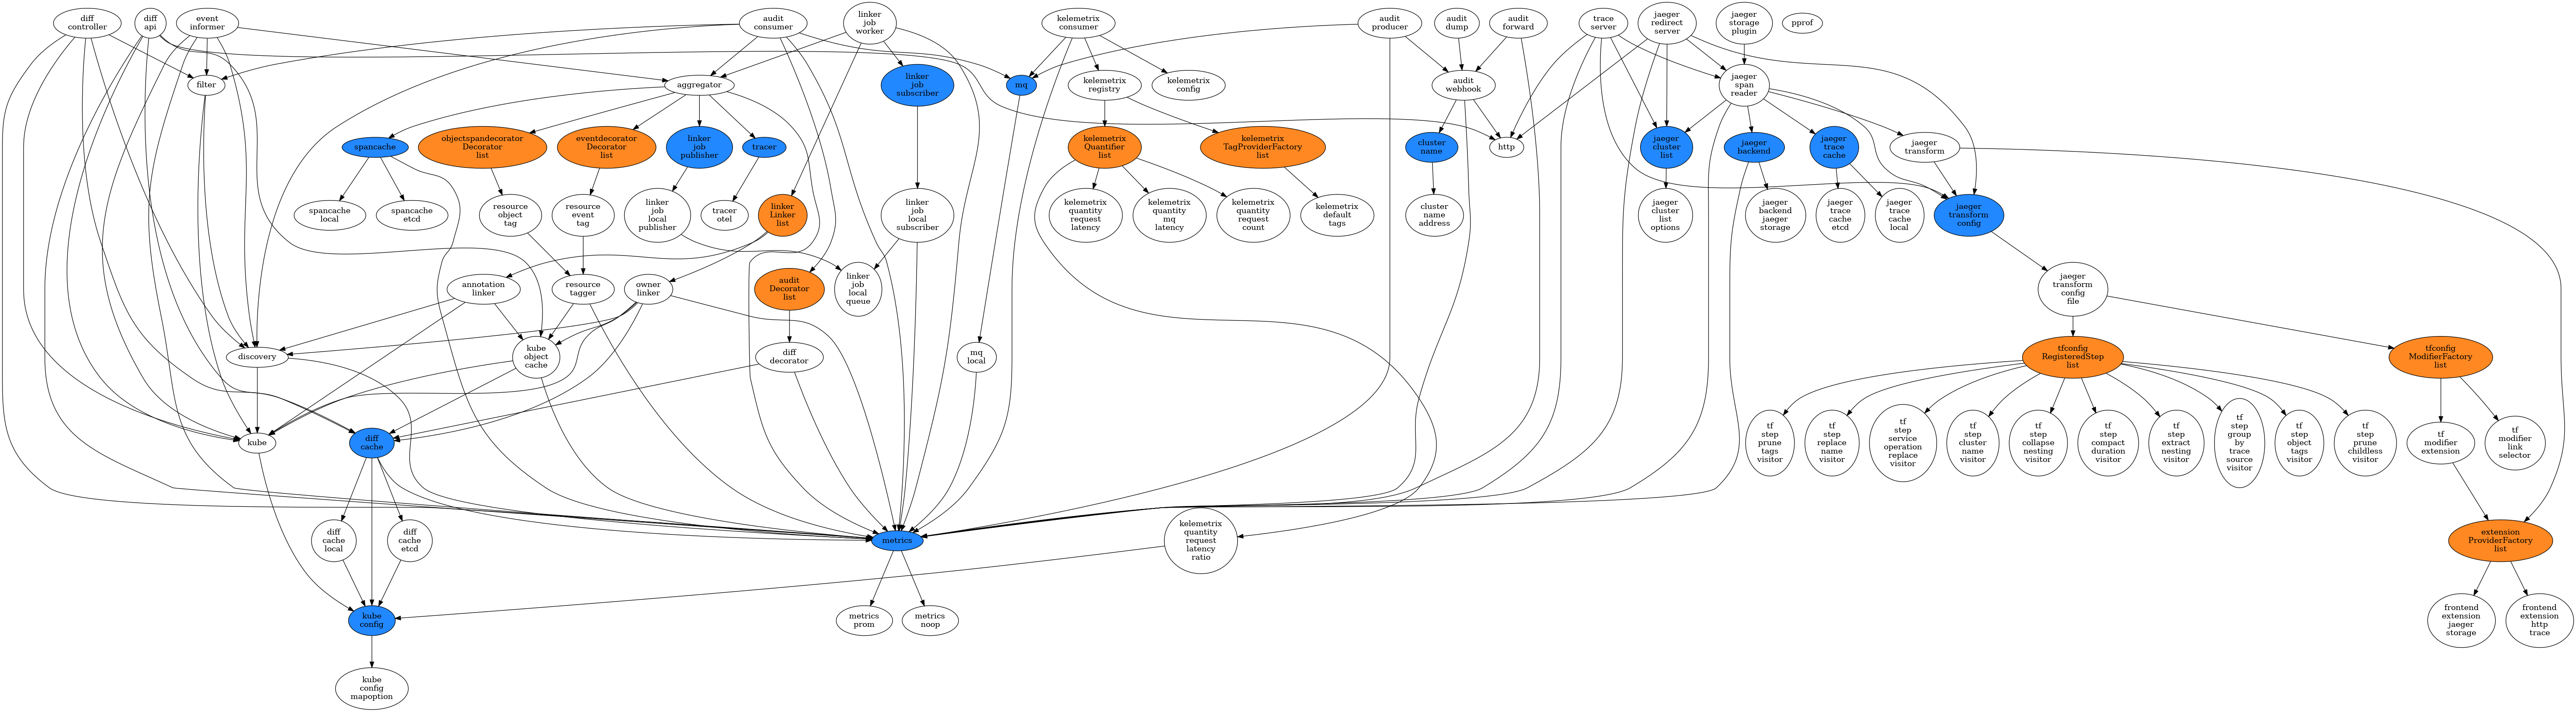
New components can be added simply by importing their package.
All default packages are imported in pkg/imports.go.
You can also build your custom binary by importing github.com/kubewharf/kelemetry/pkg
along with your custom component packages
and calling "github.com/kubewharf/kelemetry/cmd".Run().
See main.go for example.
There are a few extension points for the Kelemetry builtin packages:
- The blue components in the dependency graph above. They are "mux components" that can be substituted with new (esp. vendor-specific) implementations of the interface.
- The orange components in the dependency graph above. They are "list components" that can be extended with new (esp. vendor-specific) implementations of the interface.
- Add new spans to objects.
Use the
AggregatorAPI.
To register a component,
create a func init() that registers the component:
func init() {
  manager.Global.Provide("component-name", manager.Ptr[ExportedType](&actualType{}))
}
If the component package is not directly imported
(e.g. because it is a direct user-facing component with no direct dependents),
import it explicitly in pkg/imports.go (or in your own main.go)
so that the package is compiled in the output.
For each exported, uninitialized (zero) field in &actualType{},
the component manager will populate it as a dependency component or an util value.
A dependency component is another component registered to the manager through manager.Ptr[FieldType](...);
different components depending on the same dependency share the same instance.
An util value is a dynamically-constructed value registered through manager.ProvideUtil or implements manager.GenericUtil.
Builtin util value types include logrus.FieldLogger, clock.Clock and *metrics.Metric[T metrics.Tags].
The &actualType{} value must implement the manager.Component interface,
which provides the following methods:
Options()returns an options object that contains the component options.Options().Setup()registers options to apflag.FlagSetand stores them in the object.Options().EnableFlag()returns a nil-able bool that indicates whether the component should be enabled.- If it returns
&trueor&false, the component is always enabled/disabled. - If it returns
nil, the component is enabled only if it has an enabled dependent component.
- If it returns
Init()performs the initialization logic after all options have been parsed. The manager callsInit()on dependencies before its dependents, all on the main goroutine. However, the actual long-running tasks should not be started untilStart()is called; only initialize states like registering handlers for other components. Example tasks inInitinclude:- Validating options
- Register informer types and handlers
- Initialize connection pools
- Register metrics
Start()starts the goroutines that actually perform work. The manager only callsStart()afterInit()has been called on all components, and in the same order asInit, all on the main goroutine. The started goroutines should terminate when the givenstopChis closed.Close()should block until the components have fully shut down. It is only called afterstopChhas been closed.Close()is called in the reverse order ofInitandStart.
Mux components
A mux component is an interface that may have multiple implementations. For example, the cluster name resolver component allows users to customize their implementations of cluster name resolution (e.g. through IP address lookup).
The interface itself is registered as a normal single component,
with the constructor returning an object that embeds *manager.Mux
(and thus inherits its methods).
The interface does not need to include manager.Component in its declaration;
this allows easier mocking in unit tests.
The implementations are registered with a slightly different API:
func init() {
  manager.Global.ProvideMuxImpl("interface-name/implementation-name", manager.Ptr(&implType{}), Interface.AnyMethod)
}
The third parameter can be any function whose first parameter is the interface type.
Implementations do not necessarily need to implement the interface directly, as long as the object returned in the interface constructor knows how to delegate to the implementation, although this increases the complexity for unit testing.
The implementation also implements the manager.Component interface,
and additionally embeds manager.MuxImplBase and provides the method MuxImplName.
Only one component in the whole project can return true in the isDefault return value of MuxImplName.
It must return nil for Options.DisableFlag
and would be disabled if it is not selected in the options.
List components
A list component is an interface that may have multiple implementations.
Unlike mux components which only select one implementation,
all enabled implementations of a list component are tracked in a *manager.List[Interface] object.
The implementations are registered with the ProvideListImpl method:
func init() {
  manager.Global.ProvideListImpl("implementation-name", manager.Ptr(&implType{}), &manager.List[Interface]{})
}
The list of implementations can be retrieved by requesting a dependency field *manager.List[Interface].
List implementations are always initialized before *manager.List[Interface] users.
The list is only populated before the Init stage.
Audit
The audit package provides an audit webhook server and trace event provider based on audit webhook.
It has the following subpackages;
webhook: Runs the audit webhook HTTP server and broadcasts them to registered subscribers through an in-memory channel.producer: Receives events from the webhook and sends them to the message queue, with only one message per event. but each message contains all events from anEventListsent by kube-apiserver in one request.consumer: Consumes events from the message queue, transforming the audit events into the corresponding span(s).decorator: Allows other components to decorate trace events before they are sent to the trace aggregator.dump: Dumps audit events received from the webhook to a log file, one line of JSON object per event. For debugging.forward: Proxies audit events to other HTTP servers. Used when multiple webhook servers are configured in a chain.mq: Implements the message queue for producer and consumer. In public cloud scenarios, specially customized implementations may be required to retrieve audit events from the vendor-specific message queue.
graph TD
    kube-apiserver
        --> |for self-hosted clusters| audit-webhook[Kelemetry audit webhook]
        --> audit-mq[Message queue]
        --> consumer[Kelemetry consumer]
    kube-apiserver
        --> |for cloud-hosted clusters| cloud-mq[Host-dependent audit stream]
        ---> consumer
    consumer
        --> decorator[Audit decorators]
        --> tracer[Trace writer]
Cluster name
The clustername package resolves an audit webhook client IP into a cluster name.
Diff
The diff package decorates audit events with the object diff.
It has the following subpackages:
controller: List-watches all objects on the target cluster, compares the patch and sends the result to the diff cache.cache: Caches the object patches from the diff controller.decorator: If audit events are sent at the ResponseObject level, create and delete events are populated with the object body. If the diff controller is enabled, update events are populated with the object diff.cmp: implements the object comparison logic
graph TB
    kube-apiserver
        --> |Informer| controller/1[Controller instance]
        --> |"(Over)write"| cache["Cache\nmemory/redis"]
    kube-apiserver
        --> |Informer| controller/2[Controller instance]
        --> |"(Over)write"| cache
    kube-apiserver
        --> |...| Consumer
        --> diff-decorator --> trace[Trace writer]
    subgraph Decorators
        diff-decorator[Diff decorator]
    end
    diff-decorator --> |Read| cache
Filter
The filter package registers generic options for determining whether an object should be traced.
K8S client
The k8s package wraps kubernetes clients and informers.
Each process has a "target" cluster and also a set of other available clusters upon request.
Config
The k8s/config package provides the kubeconfigs for different clusters,
and determines the name of the target cluster.
Multileader
The k8s/multileader package provides utilities to perform multi-leader election,
allowing a fixed number (≥ 1) of distinct instances to acquire the leader lease.
This is used in diff controllers where multiple parallel instances are allowed.
Discovery
The k8s/discovery package provides utilities for mapping the GVR/GVK conversion.
This does not account for subresources.
The component updates the discovery cache every half an hour, or when an outdated component is encountered.
Event
The event package list-watches event objects from the target cluster,
transforming new events into the corresponding spans.
Maintains a namespaces/default/configmaps/kelemetry-event-controller object
to store the latest receiveed event timestamp
to avoid resending all events after restart.
Furthermore, events older than 5 minutes are discarded
as they are assumed to be the consequence of relisting.
Metrics
The metrics package abstracts metric reporting.
Each metric should be paired with a pointer-to-struct that contains the metric tags.
Aggregator
The aggregate package aggregates all span linking,
and sends them to the aggregate/tracer package which
implements the trace dispatcher and sends the actual trace.
The aggregator accepts "events" from data sources, where an event is associated with a K8S object. "Linkers" are invoked recursively to determine the "parent" object of the associated object, thus placing the span under the same trace as other events under the same ancestor objects.
You can add a component that calls LinkerList.AddLinker to define custom linking logic.
Span cache
The spancache package abstracts an expiring map[string][]byte cache.
A local layer of cache is provided to reduce cache penetration.
Frontend
The packages under frontend provide components related to Jaeger UI.
It provides a Jaeger storage plugin wrapper
that transforms the trace tree to a more user-friendly view.
When the storage plugin returns a list of traces,
it renames the trace ID to a "cache ID",
which is the key of an internal cache that stores the actual trace ID,
desired object span and the display configuration.
graph LR
    CONSUMER[Kelemetry trace writer]
        --> COLLECTOR[Jaeger collector]
        --> STORAGE[Underlying storage]
    JQUERY[Jaeger query] --> K_PLUGIN_FIND
        --> PLUGIN[Jaeger storage plugin]
        --> STORAGE
    JQUERY --> K_PLUGIN_GET --> PLUGIN
    K_PLUGIN_FIND --> |write| TRACE_CACHE[Trace cache]
    K_PLUGIN_GET --> |read| TRACE_CACHE[Trace cache]
    subgraph Kelemetry storage plugin
        K_PLUGIN_FIND[FindTrace]
        K_PLUGIN_GET[GetTrace]
    end
backend: Retrieves data from the storage that holds the output oftracer.clusterlist: Provides the list of cluster names. This is different from theclusternamepackage, which may support a wider range of cluster names (i.e. all clusters in the infrastructure), while this package is only intended for clusters with Kelemetry installed.http: Provides an HTTP endpoint that takes in raw query params and redirects to the correct Jaeger UI page. This service should be proxied behind the/redirectendpoint of an nginx server together with the Jaeger UI.reader: Implements theSpanReadergRPC endpoint.tf: Transforms the trace output to a more user-friendly UI.config: Configuration database for the different display modes.step: Implements the transformation steps, used in the config implementations.
tracecache: Implements the mapping from Cache ID to Trace ID.
Kelemetrix
Kelemetrix is a separate component that consumes audit logs into metric points. Tag providers provide string tags to use in kelemetrix.toml, and quantifiers provide scalar quantities.
End-to-end Testing
Kelemetry runs end-to-end tests on GitHub CI.
Each test suite is a directory under the e2e directory
with the following structure:
config.sh: Sourced by the e2e test script, executes a series of operations on a running cluster at$KUBECONFIGto trigger a backgroundmake quickstartto generate the test trace. Also defines the followinglocalBash variables. It is directlysourced by the e2e test script.TRACE_DISPLAY_NAME, the display name of the trace shown on the demo index.TRACE_SEARCH_TAGS, an associative array for the search tags to uniquely identify the test trace generated byclient.sh.TEST_DISPLAY_MODE, the display mode of the trace to test with.EXTRA_DISPLAY_MODES(optional), an indexed array for additional display modes to show on GitHub Pages without getting tested in the e2e test.
validate.jq: Ajqscript that takes the test trace JSON as input and fails if errors are encountered. The script may use library functions defined undere2e/lib. The current framework uses gojq as thejqimplementation.
End-to-end tests can be executed locally with the commands:
$ make kwok
$ make e2e
make e2e automatically runs make quickstart
using a custom image built from the local make output/kelemetry output.
If you prefer to run the kelemetry process directly (e.g. with a debugger),
use the following steps instead:
- Clean up all previous data by removing the stack volumes completely:
make stack COMPOSE_COMMAND='down --remove-orphans --volumes'
- Recreate the stack:
make stack COMPOSE_COMMAND='up --build -d --remove-orphans'
-
Run Kelemetry with your preferred method equivalent to
make. -
Execute the e2e test script:
bash e2e/run-all.sh