README.md
February 12, 2026 · View on GitHub

![]()
![]()


Meteostat Python Package
Access and analyze historical weather and climate data with Python.
📚 Installation
The Meteostat Python package is available through PyPI:
pip install meteostat
🚀 Usage
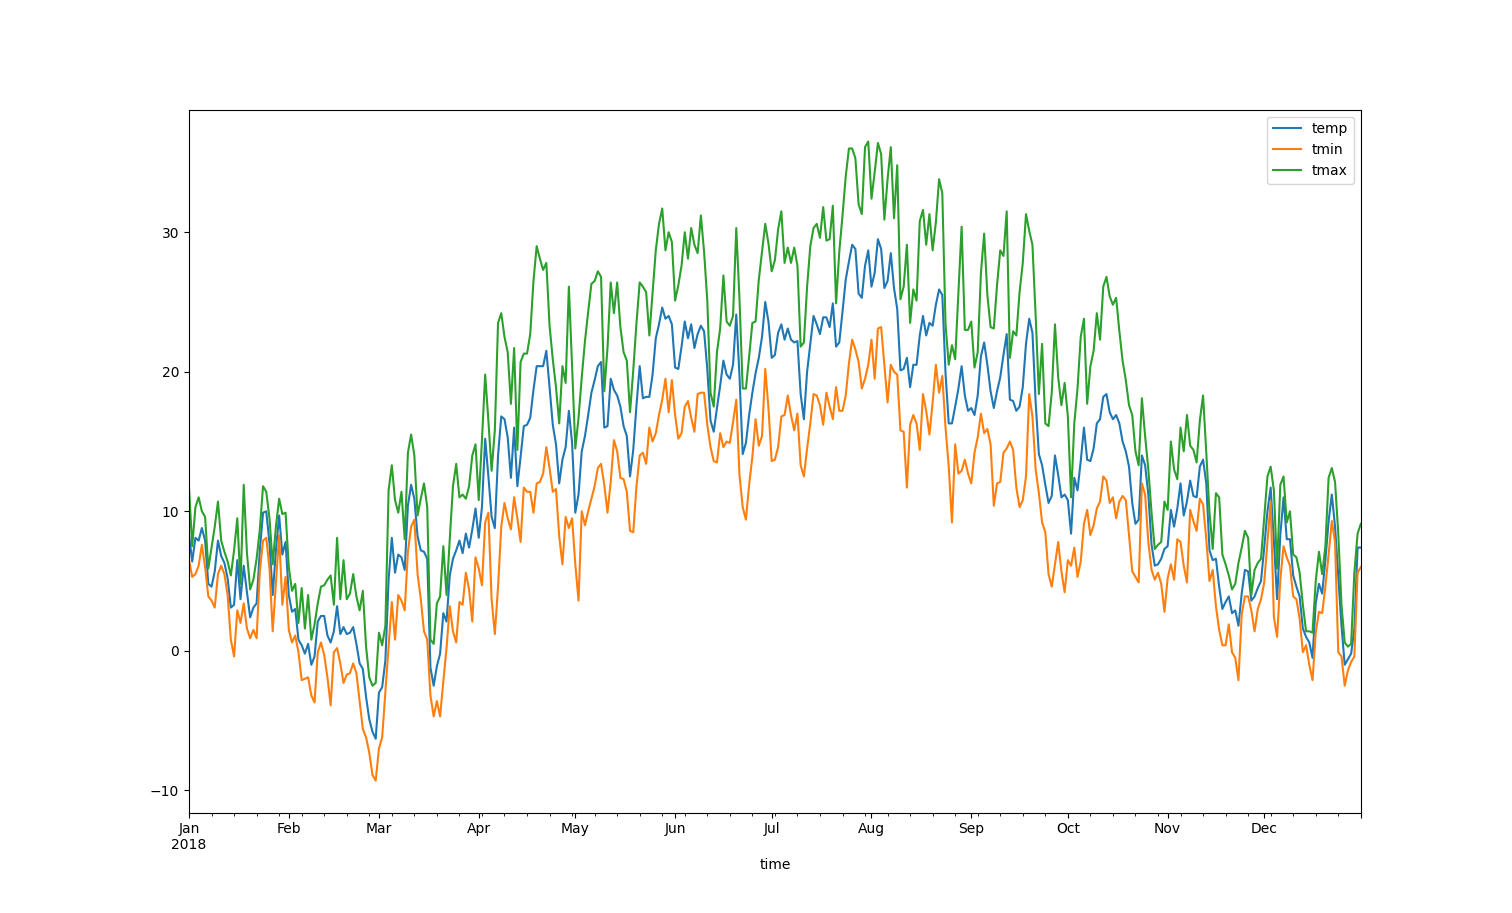
Let's plot 2018 temperature data for Frankfurt, Germany:
from datetime import date
import matplotlib.pyplot as plt
import meteostat as ms

# Specify location and time range
POINT = ms.Point(50.1155, 8.6842, 113)  # Try with your location
START = date(2018, 1, 1)
END = date(2018, 12, 31)

# Get nearby weather stations
stations = ms.stations.nearby(POINT, limit=4)

# Get daily data & perform interpolation
ts = ms.daily(stations, START, END)
df = ms.interpolate(ts, POINT).fetch()

# Plot line chart including average, minimum and maximum temperature
df.plot(y=[ms.Parameter.TEMP, ms.Parameter.TMIN, ms.Parameter.TMAX])
plt.show()
Take a look at the expected output:
🤝 Contributing
Please read our contributing guidelines for details on how to contribute to the Meteostat Python library.
Top contributors
🌟 Featured In
Meteostat has been featured and used by various media outlets and organizations, including:
Join the growing community of users and researchers relying on Meteostat for their weather data needs.
📄 License
Meteostat is licensed under the MIT License. Data provided by Meteostat is generally licensed under the Creative Commons Attribution 4.0 International (CC BY 4.0) license. Please refer to the documentation for more information.