Gigapipe: All-In-One Polyglot Observability
August 28, 2026 · View on GitHub
 Gigapipe: All-In-One Polyglot Observability
formerly known as qryn




:rocket: Gigapipe is a lighweight, multi-standard, polyglot observability stack for Logs, Metrics, Traces and Profiling
- Polyglot: All-in-one, drop-in compatible with Loki, Prometheus, Tempo, Pyroscope
- Familiar: Use stable & popular LogQL, PromQL, TempoQL languages to query and visualize data
- Voracious: Ingest using OpenTelemetry, Loki, Prometheus, Tempo, Influx, Datadog, Elastic + more
- Versatile: Explore data with qryn's built-in Explorer and CLI or native Grafana datasource compatibility
- Secure: Retain total control of data, using ClickHouse, DuckDB or GigAPI with S3 object storage
- Independent: Open source, community powered, anti lock-in alternative to vendor controlled stacks
🚀 Get Started
- Setup & Deploy gigapipe opensource and get help in our Matrix room :octocat:
- Looking for a quick test before installing? Signup for a free trial at gigapipe.com
📚 Documentation
- Configuration & Docker — environment variables, Docker quickstart, cross-cluster setup
- Profiling API — profiling endpoints, DOT format export, Graphviz visualization
- OTLP Profiles Ingestion — OpenTelemetry profiles signal ingestion via
/v1development/profiles - OTLP Metrics Ingestion — OpenTelemetry metrics signal ingestion via
/v1/metrics(protobuf + JSON) - OTLP over gRPC — OTLP/gRPC receiver for traces, logs, metrics, and profiles
- Contributing — development setup, testing, CLA requirement
- Full Documentation — hosted docs at gigapipe.com

Features
💡 gigapipe independently implements popular observability standards, protocols and query languages
➡️ Ingestion
📚 OpenTelemetry
⚡ gigapipe is officially integrated with OpenTelemetry supports any log, trace or metric format
Ingested data can be queried using any of the available gigapipe APIs (LogQL, PromQL, TraceQL)
💡 No modifications required to your OpenTelemetry instrumentation!
📚 Native APIs
gigapipe supports native ingestion for Loki, Prometheus, Tempo/Zipkin, Pyroscope and many other protocols
With gigapipe integrators can push and read data using any desired combination of APIs and formats
💡 No opentelemetry or any other middlewayre/proxy required!
⬅️ Query
📚 Loki + LogQL
Any Loki compatible client or application can be used with gigapipe out of the box
⚡ gigapipe implements the Loki API for transparent compatibility with LogQL clients
The Grafana Loki datasource can be used to natively browse and query logs and display extracted timeseries

:tada: No plugins needed
:eye: No Grafana? No problem! Use View
Index Stats & Enhanced Tail
Index statistics: Query stream metadata using /loki/api/v1/index/stats to retrieve stream count, entry count, byte volume, and chunk count. Supports LogQL stream selectors for filtering:
GET /loki/api/v1/index/stats?query={job="app"}&start=<ns>&end=<ns>
Enhanced live-tail: The Tail service now supports limit and start query parameters for controlling tail behavior. The limit parameter caps the number of entries returned, and start sets the starting timestamp (in nanoseconds). WebSocket responses include a dropped_entries field indicating when entries were dropped due to backpressure:
{
  "streams": [...],
  "dropped_entries": []
}
📈 Prometheus + PromQL
Any Prometheus compatible client or application can be used with gigapipe out of the box
⚡ gigapipe implements the Prometheus API for transparent PromQL compatibility using WASM 🏆
The Grafana Prometheus datasource can be used to natively to query metrics and display timeseries

:tada: No plugins needed
:eye: No Grafana? No problem! Use View
🕛 Tempo + TraceQL
⚡ gigapipe implements the Tempo API for transparent compatibility with TraceQL clients.
Any Tempo/OpenTelemetry compatible client or application can be used with gigapipe out of the box
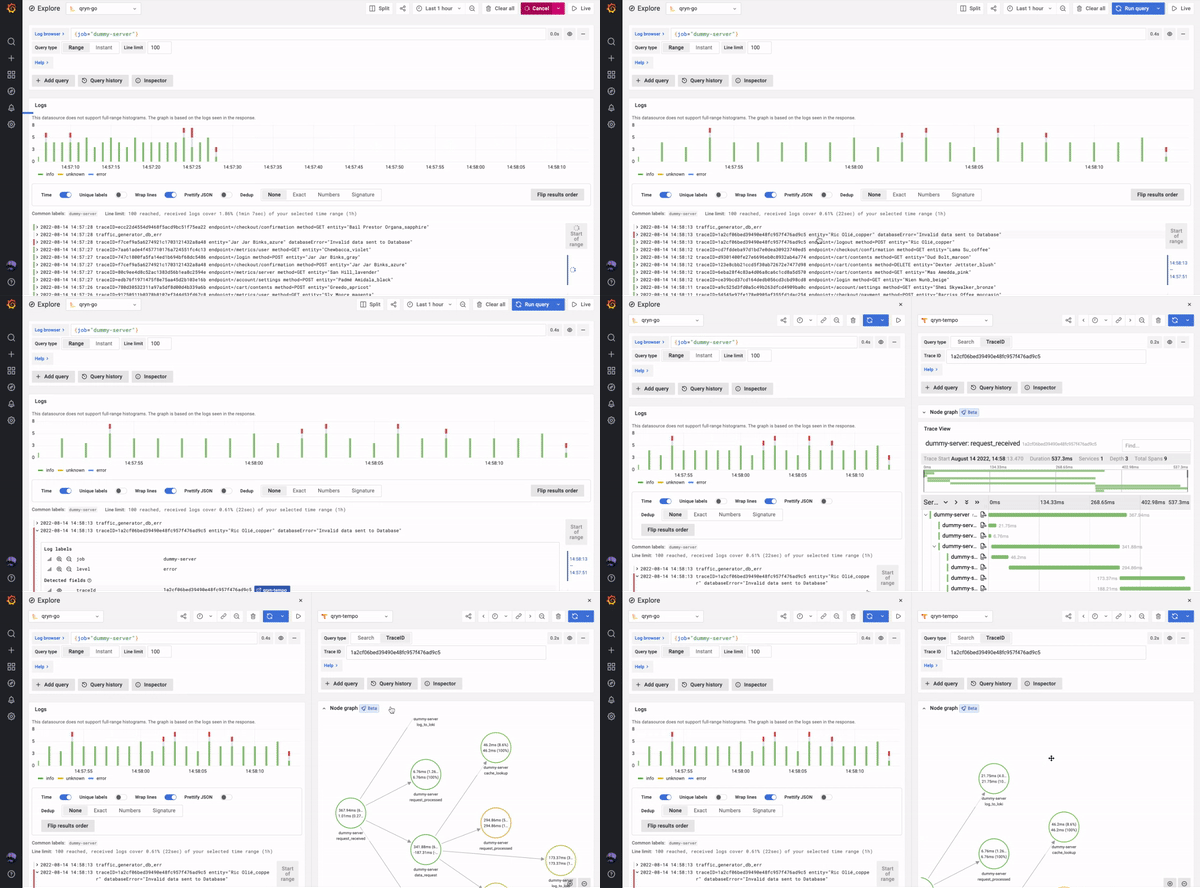
The Tempo datasource can be used to natively query traces including TraceQL and supporting service graphs

:tada: No plugins needed
:eye: No Grafana? No problem! Use View
TraceQL Metrics
gigapipe supports TraceQL metrics endpoints for calculating metrics from trace data. Calculate error rates, latency distributions, and throughput directly from traces using TraceQL queries.
Metrics endpoints:
/api/metrics/query_range- range queries over a time window/api/metrics/query- instant queries at a specific time
Parameters:
qorquery- TraceQL query string (required)start- start timestamp (unix seconds, nanoseconds, or RFC3339)end- end timestamp (same format as start)since- relative time duration (e.g., "1h", "30m") - alternative to start/endstep- query resolution (e.g., "15s", "1m") - auto-calculated if not specified
Example:
GET /api/metrics/query_range?q={span.http.status_code=200}&since=1h&step=1m
This query calculates span counts for successful HTTP requests over the last hour with 1-minute resolution.
🔥 Pyroscope + Phlare
⚡ gigapipe implements the Pyroscope API for transparent compatibility with Pyroscope SDK clients.
Any Pyroscope SDK client or Pyroscope compatible agent can be used with gigapipe out of the box for continuous profiling
OTLP Profiles Ingestion
⚡ gigapipe also ingests the OpenTelemetry profiles signal (profiles/v1development) directly from OpenTelemetry collectors:
POST /v1development/profiles Content-Type: application/x-protobuf
💡 No collector code changes required — point an
otlphttpexporter at gigapipe and profiles flow in.
OTLP profiles land in the same ClickHouse profiles tables as Pyroscope data and are queryable through the existing Pyroscope-compatible API (flamegraph, series, stacktraces). See docs/otlp-profiles.md for details.
DOT Graph Rendering
The Render endpoint (/render?format=dot) generates Graphviz DOT format graphs for profiling visualization with enhanced readability:
Features:
maxNodesparameter: Limit the number of nodes displayed in DOT graphs (0 = unlimited). Use this to control graph complexity for large profiles.GET /render?query=...&from=...&until=...&format=dot&maxNodes=50- Human-readable values: Automatically formats values based on unit type (e.g., "1.23s" for durations, "1.23 MB" for memory)
- Variable font sizes: Node font size scales from 8pt to 24pt based on self-sample percentage, creating visual hierarchy where hotter code paths are more prominent
:eye: Built-In Explorer
gigapipe ships with view - our zero dependency, lightweight data explorer for Logs, Metrics and Traces

📚 Vendors Compatibility
gigapipe can ingest data using formats from Grafana, InfluxDB, DataDog, Elastic and other vendors.
With gigapipe and Grafana everything just works right out of the box:
- Native datasource support without any plugin or extension
- Advanced Correlation between Logs, Metrics and Traces
- Service Graphs and Service Status Panels, and all the cool features
📚 Follow our team behind the scenes on the gigapipe blog
Contributions
Whether it's code, documentation or grammar, we ❤️ all contributions. See docs/contributing.md to get started.
- Join our Matrix Channel, and ask us any questions.
- Have a PR or idea? Request a session / code walkthrough with our team for guidance.
Contributors
License

©️ HEPVEST BV, All Rights Reserves. Released under the GNU Affero General Public License v3.0