Topology Visualization with Graphite
January 25, 2026 · View on GitHub
A combination of netreplica nrx and graphite tools can be used to visualize NetBox topology data.
Why Graphite?
Unlike typical plugin-based visualizers, this method:
- Works with a standard NetBox instance without any plugins installed
- Doesn't require administrative access to the NetBox host
- Provides interactive, web-based topology visualization
- Supports multiple layout algorithms
- Allows easy topology sharing and presentation
Prerequisites
- Docker installed
- NetBox API access with a valid token
- nrx installed and configured
Step 1: Export from NetBox
Export topology data from NetBox in the Graphite format:
export NB_API_TOKEN='replace_with_valid_API_token'
nrx --api https://demo.netbox.dev \
    --site DM-Akron \
    --templates templates \
    --output graphite
This creates:
DM-Akron/DM-Akron.graphite.json- Graphite topology file
Command Options
--api- NetBox API URL--site- NetBox site to export--templates- Path to template directory--output graphite- Export in Graphite format
Step 2: Start Graphite
Start Graphite to visualize the topology:
TOPOLOGY="$(pwd)/DM-Akron/DM-Akron.graphite.json"
docker run -d -t --rm \
    --mount type=bind,source="${TOPOLOGY}",target=/htdocs/default/default.json,readonly \
    -p 8080:80 \
    --name graphite \
    netreplica/graphite:latest
Access the Visualization
Open http://localhost:8080/graphite in your browser to see the topology.
Remote Access
If you're running Graphite on a remote host or inside a VM, use this helper to show the working URL:
docker exec -t -e HOST_CONNECTION="${SSH_CONNECTION}" graphite graphite_motd.sh 8080
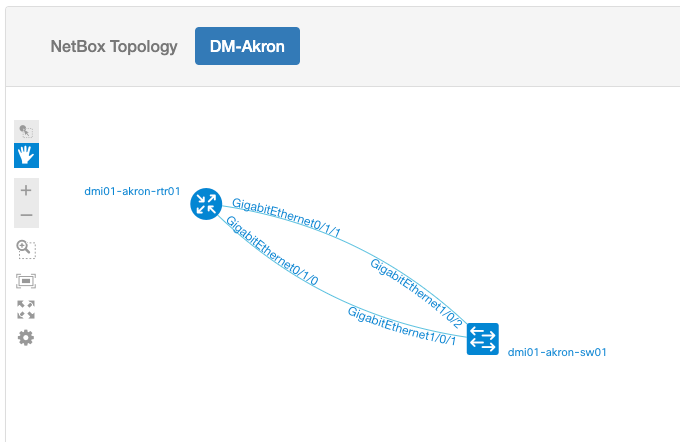
Example Visualization
The visualization will show:
- Nodes - Devices from NetBox with roles, names, and metadata
- Edges - Connections between devices
- Layout - Hierarchical arrangement based on device roles
- Interactivity - Zoom, pan, select, and inspect elements
Step 3: Stop Graphite
When done, stop the Graphite container:
docker stop graphite
Working with Multiple Topologies
If you'd like to switch between multiple exported topologies without restarting Graphite:
Method 1: Volume Mount
Mount a directory containing multiple topology files:
docker run -d -t --rm \
    --mount type=bind,source="$(pwd)/topologies",target=/htdocs/topologies,readonly \
    -p 8080:80 \
    --name graphite \
    netreplica/graphite:latest
Access topologies at:
http://localhost:8080/graphite?topology=DM-Akron.graphite.jsonhttp://localhost:8080/graphite?topology=DM-Albany.graphite.json
Method 2: Multiple Instances
Run multiple Graphite instances on different ports:
# Topology 1 on port 8080
docker run -d -t --rm \
    --mount type=bind,source="$(pwd)/DM-Akron/DM-Akron.graphite.json",target=/htdocs/default/default.json,readonly \
    -p 8080:80 \
    --name graphite-akron \
    netreplica/graphite:latest

# Topology 2 on port 8081
docker run -d -t --rm \
    --mount type=bind,source="$(pwd)/DM-Albany/DM-Albany.graphite.json",target=/htdocs/default/default.json,readonly \
    -p 8081:80 \
    --name graphite-albany \
    netreplica/graphite:latest
Advanced Usage
Export Multiple Sites
# Export multiple sites
nrx --api https://demo.netbox.dev \
    --sites "site1,site2,site3" \
    --output graphite \
    --dir multi-site
Filter by Tags
nrx --api https://demo.netbox.dev \
    --tags "production,core" \
    --output graphite \
    --name prod-core
Custom Styling
Graphite supports custom styling of nodes and edges based on metadata. See Graphite documentation for details on customization.
Graphite Features
Layout Algorithms
Graphite supports multiple layout algorithms:
- Hierarchical - Top-down based on device roles (default)
- Force-directed - Physics-based automatic layout
- Circular - Nodes arranged in a circle
- Grid - Regular grid arrangement
Interaction
- Zoom - Mouse wheel or pinch gesture
- Pan - Click and drag
- Select - Click on nodes or edges
- Info - View detailed metadata in side panel
Export
- PNG - Export current view as image
- Share - Generate shareable links
- Embed - Get embed code for presentations
Integration with CI/CD
Graphite visualization can be integrated into CI/CD pipelines:
# Generate topology visualization as part of documentation build
nrx --api $NB_API_URL \
    --site production \
    --output graphite \
    --dir docs/topologies

# Serve with static site generator
Troubleshooting
Empty Visualization
If Graphite shows an empty canvas:
- Check that the JSON file was created correctly
- Verify the file path in the Docker mount command
- Check browser console for errors
Port Already in Use
If port 8080 is already in use:
# Use a different port
docker run -d -t --rm \
    --mount type=bind,source="${TOPOLOGY}",target=/htdocs/default/default.json,readonly \
    -p 8888:80 \
    --name graphite \
    netreplica/graphite:latest
Debug Mode
Enable debug output when exporting:
nrx --debug \
    --api https://demo.netbox.dev \
    --site DM-Akron \
    --output graphite
Alternative: D2 Format
nrx also supports exporting to D2 declarative diagram language:
nrx --api https://demo.netbox.dev \
    --site DM-Akron \
    --output d2
D2 files can be rendered to SVG or PNG using the D2 CLI tool.
Next Steps
- Graphite Documentation - Learn more about Graphite
- Containerlab Example - Deploy labs from visualized topologies
- Platform Map - Customize node appearance
- Templates - Customize visualization output