Layout Configuration
January 25, 2021 · View on GitHub
Aside from chart sizes, users can also change the sizes for different components. Users can define x-axis, y-axis, plot area size, and legend width, and it can be useful when using multiple charts and having to fix the width of a chart.
X Axis
With charts that use the x-axis, the size of the x-axis area can be defined. The xAxis can be used with width and height options. Using the width and height options, users can define the size of the area where the x-axis is painted.
type xAxisOption = {
  ...
  width?: number;
  height?: number;
};
const options = {
  xAxis: {
    title: 'Amount',
    width: 700,
    height: 100
  }
};

Y Axis
With charts that use the y-axis, the size of the y-axis area can be defined. The yAxis can be used with width and height options. Using the width and height options, users can define the size of the area where the y-axis is painted.
type yAxisOption = {
  ...
  width?: number;
  height?: number;
};
const options = {
  yAxis: {
    width: 100,
    height: 350,
    title: 'Month'
  }
};

It can be used to change the size of the center y-axis area for Bar charts that use series.diverging option.
const options = {
  yAxis: {
    title: 'Age Group',
    align: 'center',
    width: 100,
    height: 300
  },
  xAxis: {
    label: {
      interval: 2
    },
    title: 'People'
  },
  series: {
    diverging: true
  }
};

Plot
The plot is used with all charts and provides width and height options. Using the width and height options, users can define the size of the area where the chart is actually painted.
type PlotOption = {
  width?: number;
  height?: number;
  ...
};
const options = {
  plot: {
    width: 800,
    height: 400
  }
};

- When both width of the x-axis (
xAxis.width) and width of the plot (plot.width) are provided, the greater of the two is used. - When both height of the y-axis (
yAxis.height) and height of the plot (plot.height) are provided, the greater of the two is used.
Legend
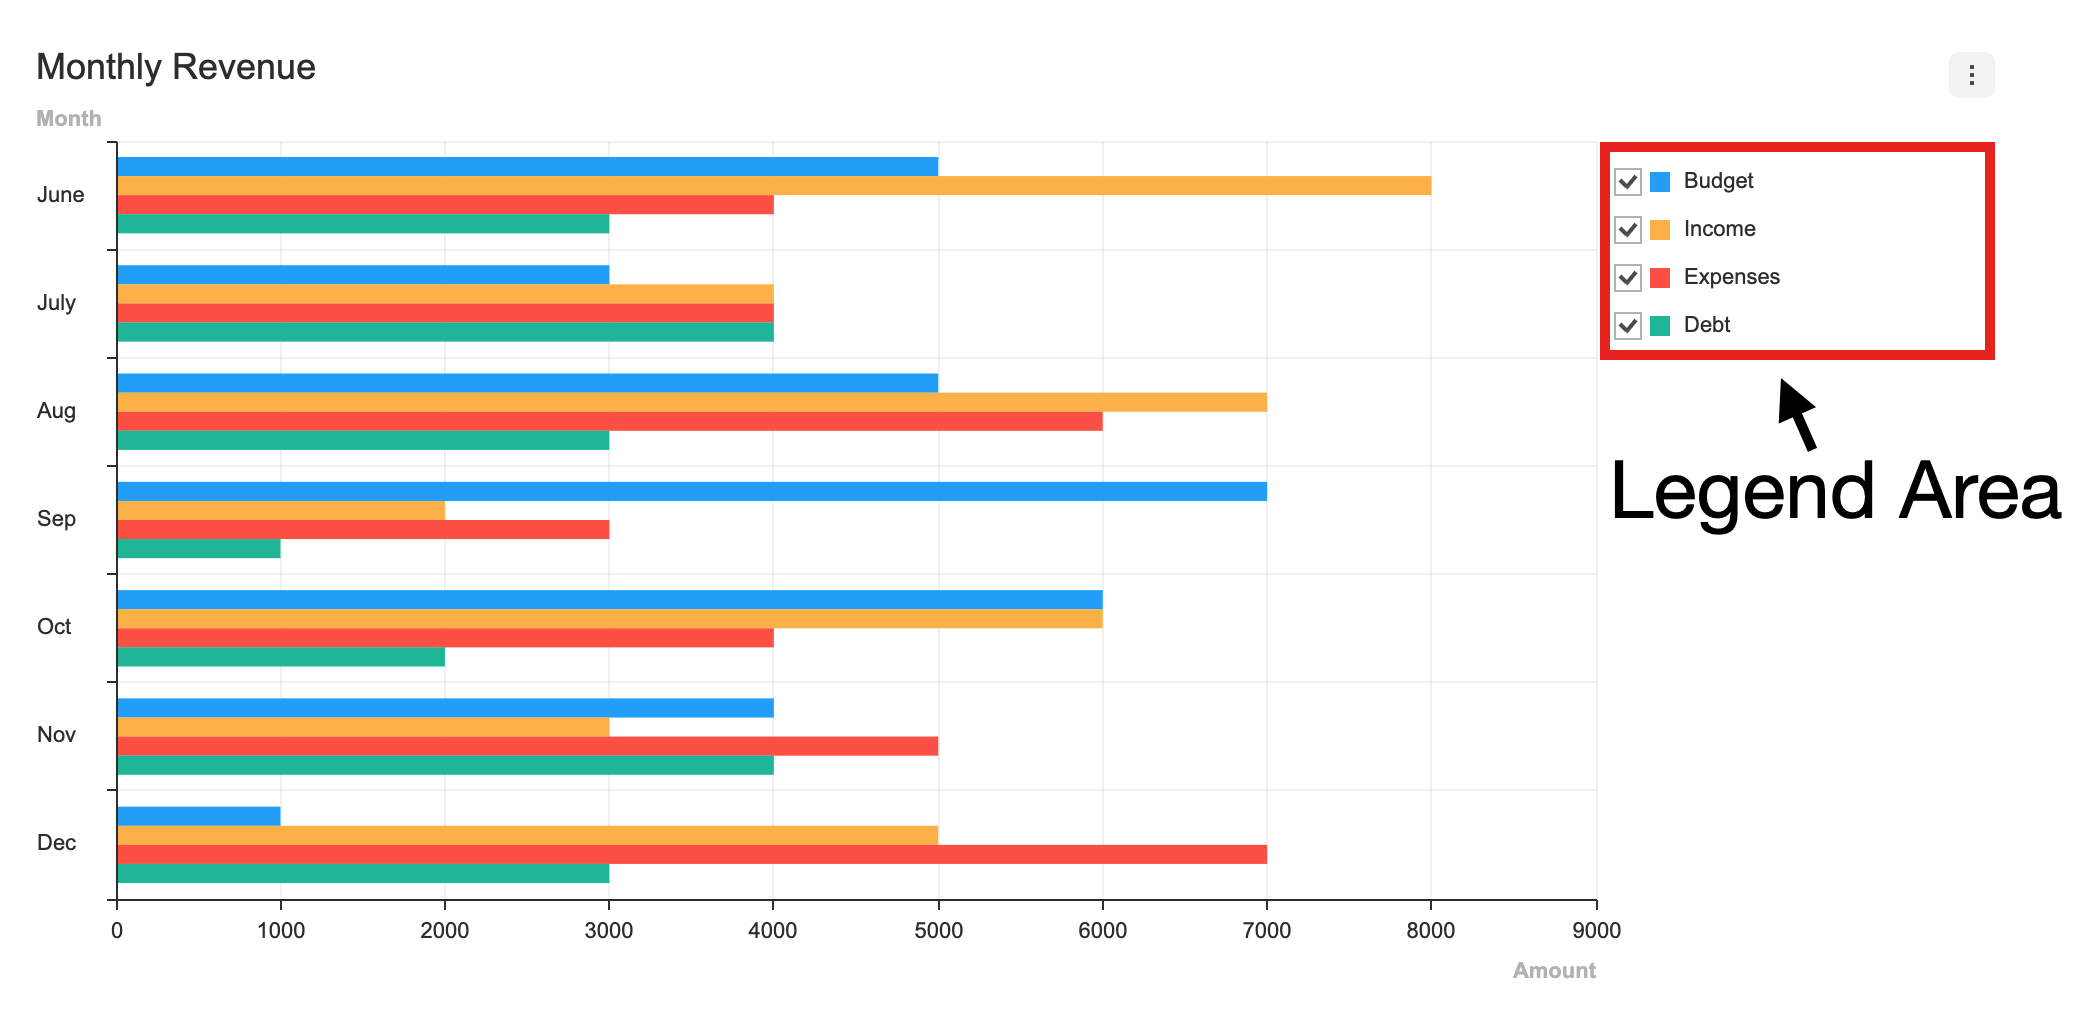
The legend is used with all charts and provides width option. The width option can be used to fix the width of the legend.
type LegendOptions = {
  ...
  maxWidth?: number;
  width?: number;
};
const options = {
  legned: {
    width: 200
  }
};