레이아웃 설정
January 25, 2021 · View on GitHub
차트 크기를 변경하는 것 외에도 각 컴포넌트의 크기를 지정할 수 있다. X축, Y축, 플롯 영역의 크기 및 범례의 너비를 정할 수 있으며, 여러 차트를 사용하는 경우 차트의 너비를 고정하고 싶을 때 유용하게 사용할 수 있다.
X축
X축을 사용하는 차트에서는 X축 영역의 크기를 지정할 수 있다. xAxis 옵션으로 width, height를 제공한다. width, height 값을 지정하면 실제 X축이 그려지는 영역의 크기를 설정할 수 있다.
type xAxisOption = {
  ...
  width?: number;
  height?: number;
};
const options = {
  xAxis: {
    title: 'Amount',
    width: 700,
    height: 100
  }
};

Y축
Y축을 사용하는 차트에서는 Y축 영역의 크기를 지정할 수 있다. yAxis 옵션으로 width, height를 제공한다. width, height 값을 지정하면 실제 Y축이 그려지는 영역의 크기를 설정할 수 있다.
type yAxisOption = {
  ...
  width?: number;
  height?: number;
};
const options = {
  yAxis: {
    width: 100,
    height: 350,
    title: 'Month'
  }
};

sereis.diverging 옵션을 사용할 수 있는 Bar 차트에서 가운데 Y축 영역의 크기도 변경할 수 있다.
const options = {
  yAxis: {
    title: 'Age Group',
    align: 'center',
    width: 100,
    height: 300
  },
  xAxis: {
    label: {
      interval: 2
    },
    title: 'People'
  },
  series: {
    diverging: true
  }
};

플롯
기본적으로 모든 차트에서 사용하는 plot 옵션으로 width, height를 제공한다. width, height 값을 지정하면 실제 차트 시리즈가 그려지는 영역의 크기를 설정할 수 있다.
type PlotOption = {
  width?: number;
  height?: number;
  ...
};
const options = {
  plot: {
    width: 800,
    height: 400
  }
};

- X축의 너비(
xAxis.width)와 플롯의 너비(plot.width)를 모두 입력하면 둘 중에 최댓값으로 설정된다. - Y축의 높이(
yAxis.height)와 플롯의 높이(plot.height)를 모두 입력하면 둘 중에 최댓값으로 설정된다.
범례
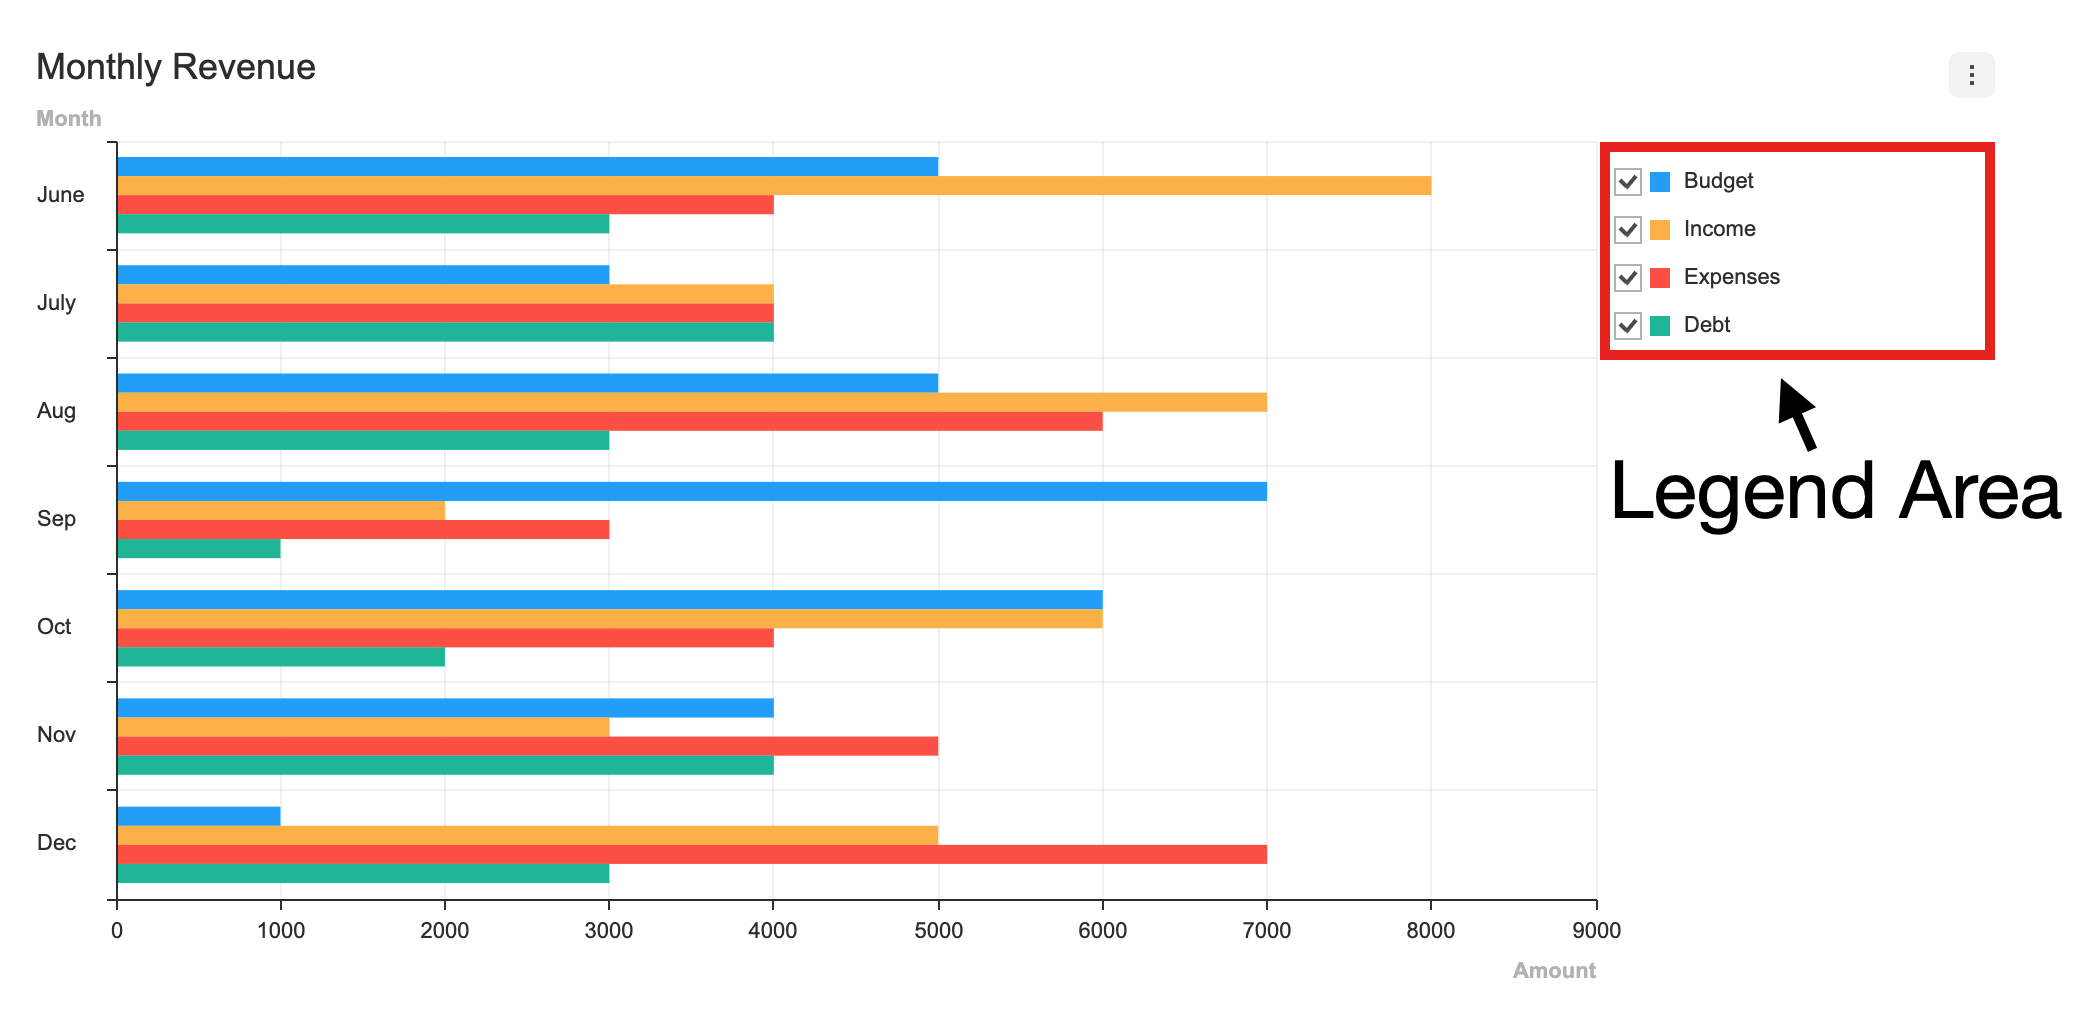
기본적으로 모든 차트에서 사용하는 legend 옵션은 범례의 너비를 지정하기 위해 width 옵션을 제공한다. width를 지정하면 범례의 너비가 고정된다.
type LegendOptions = {
  ...
  width?: number;
};
const options = {
  legned: {
    width: 200
  }
};