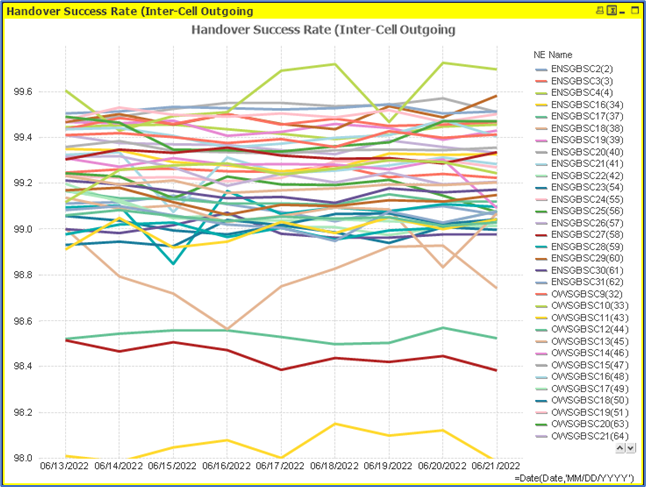
Qlikview-Multi-RAT-Cell-Level-Dashboards
August 5, 2022 · View on GitHub
The below are some functionalities that the dashboards can help your project achieve;
Identification and filtering out of degrading cells.
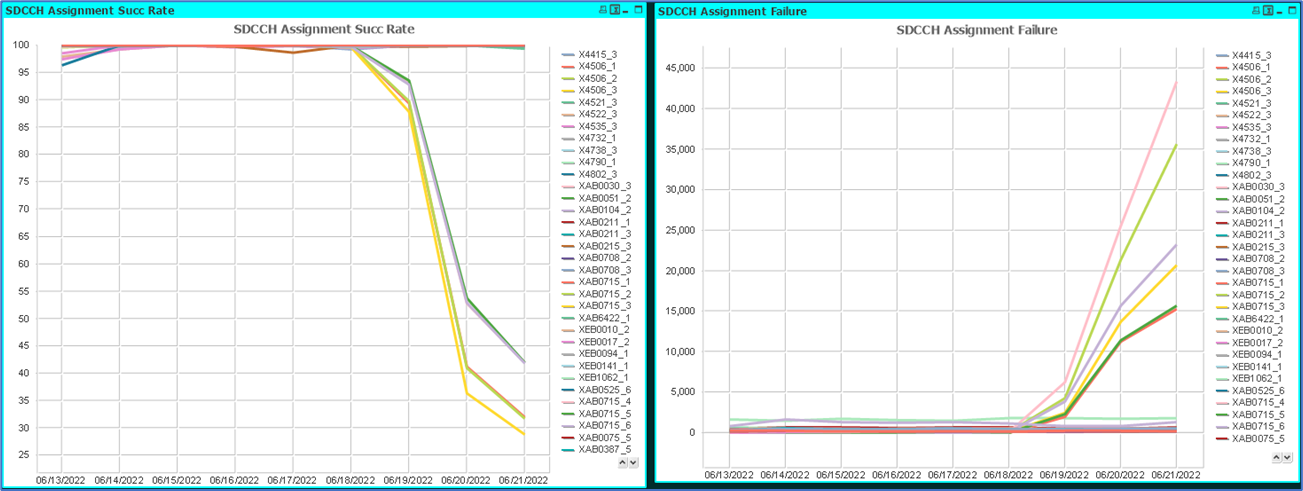 We can see some cells degrading in the above snapshot.
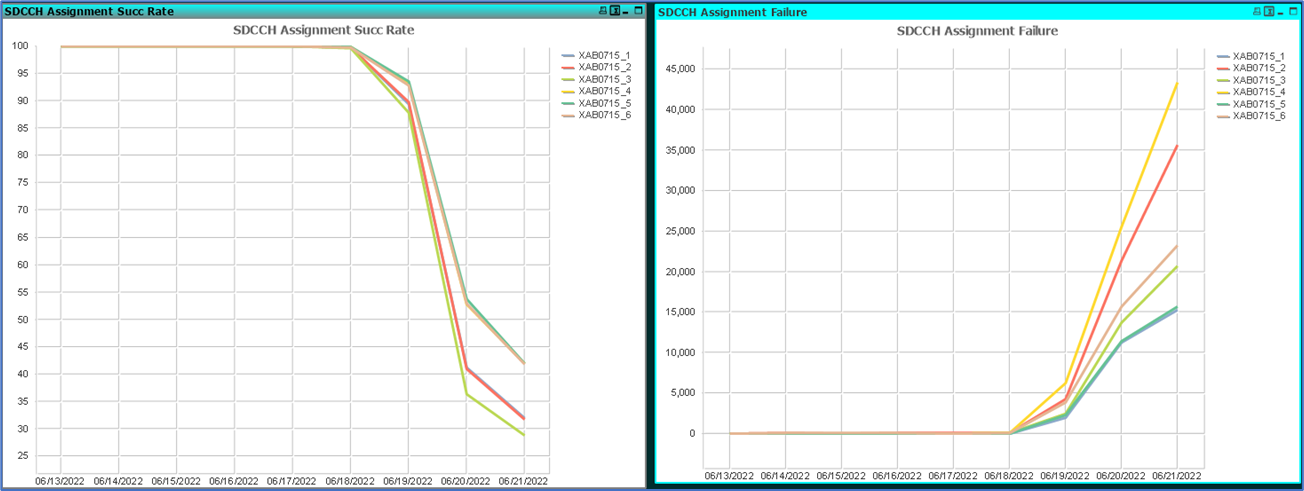 Now the degraded cells have been filtered out. This filter action will at the same time run on all other KPI charts.
Also, a scatter chart can be configured for the easy identification of worst performing cells.
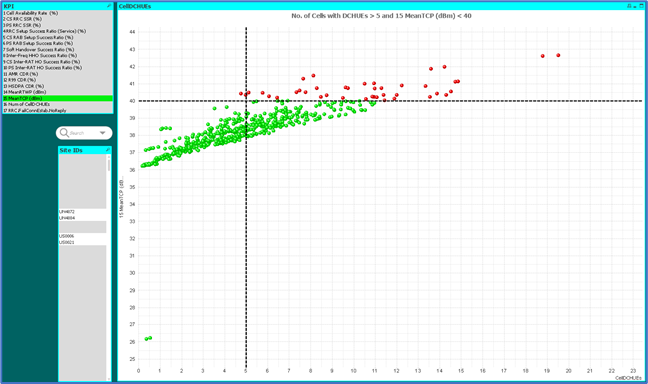
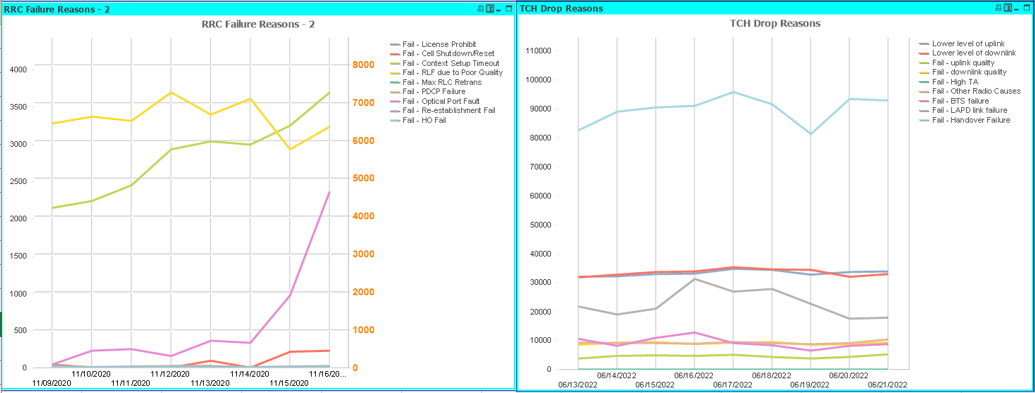
Failure reasons can also be analyzed in the dashboard and worst performing cells filtered out based on the failure reasons.
Also, data aggregation to BSC/RNC/Region/Cluster and City levels can be achieved for analysis on a wider scale.