rstat
June 4, 2026 · View on GitHub
Warning
rstat is a demonstration and performance research exercise, not a production
desktop application. It is provided as an educational resource on eBPF
programming and low-overhead system telemetry.
It has not undergone the QA, compatibility work, hardening, or security testing expected of general desktop software. It still has a fixed BPF map capacity and assumes a Linux host with BTF, eBPF tracepoints, and the privileges needed to load probes. Proper desktop monitoring software needs substantial validation that this project will not receive.
A system monitor that runs inside the kernel. Single-digit microseconds per
switch, sub-millisecond per sample. More data than top, iotop, and ps
combined.
Most system monitors read /proc -- opening, reading, and closing thousands of
files every refresh cycle. top does it. btop does it. They parse ASCII text
the kernel formatted from data structures it already had in memory. It is a
serialisation round-trip through the filesystem for numbers the kernel could
hand you directly.
rstat skips the per-refresh walk. At startup it compiles its bundled eBPF
source against the running kernel's BTF, then loads the verified bytecode into
the kernel's scheduler path. When the CPU switches between tasks, the probe
reads CPU time, RSS, and IO counters directly from task_struct. Userspace reads
the results from a BPF map in a single batch operation.
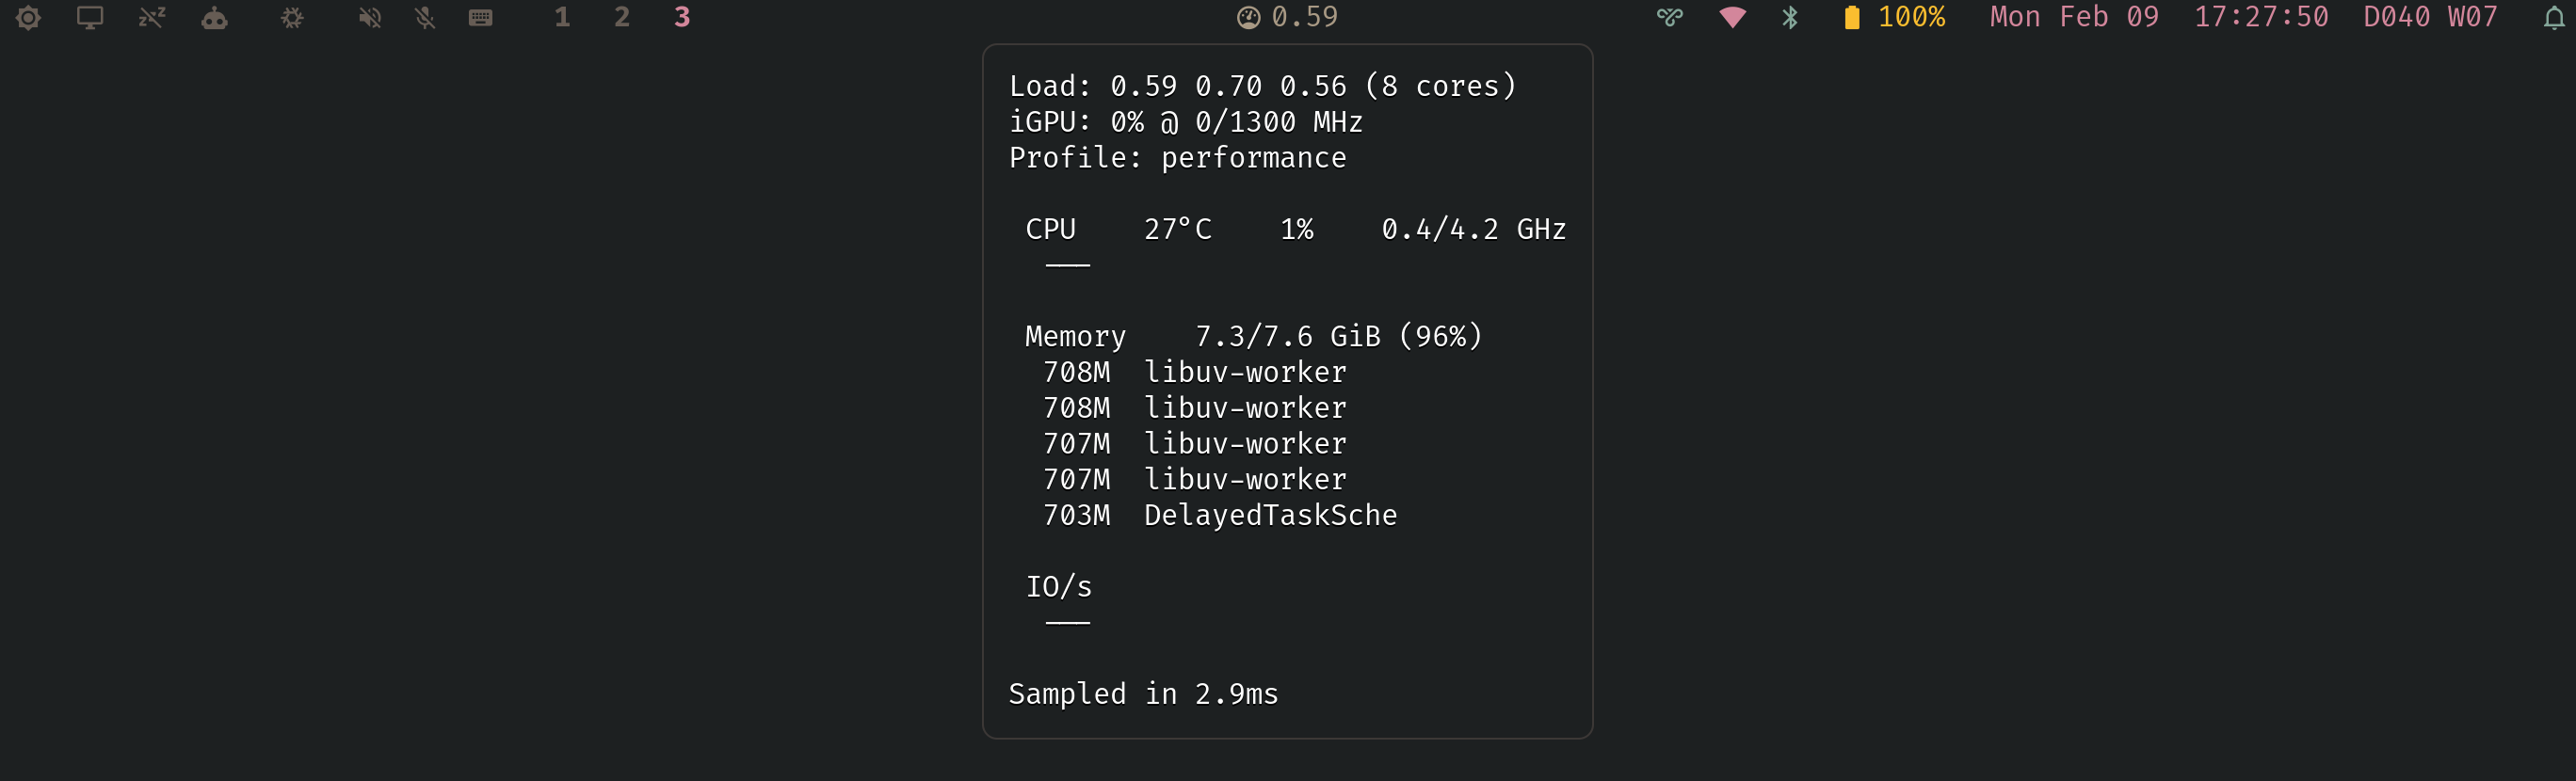
The result: a complete system health snapshot (CPU%, memory, memory pressure, swap rate, load, temperature, frequency, GPU, power profile, top-5 processes by CPU/memory/IO with per-process breakdowns) in under 1 millisecond per sample, with each in-kernel probe invocation completing in single-digit microseconds.
How it works
Three BPF tracepoint probes:
sched_switch-- accounts CPU time, snapshots RSS and IO for the outgoing tasksched_process_exit-- marks zombies (Z-state), clears seen flag for client handshakesched_process_free-- cleans up reaped processes
Runtime guarantees:
- Strict probe health checks at startup (required tracepoints must attach)
- Single-instance lock to avoid partial/competing probe attachments
- Per-thread kernel data aggregated to per-process rows in userspace (by TGID)
- PID reuse guarded with a per-PID generation key
- Memory PSI (
/proc/pressure/memory) and swap counters (/proc/vmstat) read from persistent file descriptors each sample (no per-tick reopen churn) - Hardware-specific sysfs metrics are optional; missing CPU/GPU/profile files
render as
n/a
Startup /proc scan seeds any pre-existing D/Z processes into the BPF map so they're visible from the first sample.
Userspace daemon:
- Custom ELF loader (no aya, no libbpf-rs, no tokio)
- Runtime probe compilation from bundled source and live kernel BTF
- Batch map reads with pre-allocated arrays
- Hand-written JSON emitter (no serde)
- All buffers pre-allocated and reused
Performance
| Stage | Time | Approach |
|---|---|---|
| Bash + coreutils | ~800 ms | Fork 8-12 subprocesses per sample |
| Rust + /proc | ~700 ms | Direct /proc parsing, one subprocess remained |
| Optimised /proc | ~15 ms | Sysfs, reusable buffers, byte-level parsing |
| eBPF | <1 ms | BPF probes, batch map reads, hand-written JSON |
The long-running process has a small dependency set (libc, goblin); the Nix
package also keeps bpftool, clang, and libbpf headers available for startup
probe compilation.
Building
Rust, by the way. On NixOS, by the way.
Requires Nix with flakes:
nix build
The Nix package builds the Rust binary and stamps absolute paths to bpftool,
clang, and libbpf headers into it. On startup, rstat captures the running
kernel's BTF, pipes the combined probe source through clang, and loads the
compiled object from memory.
The binary requires CAP_SYS_ADMIN (or equivalent, e.g. NixOS
security.wrappers) for bpf() and perf_event_open().
Waybar integration
"custom/sysmon": {
    "exec": "rstat",
    "return-type": "json",
    "restart-interval": 0,
    "on-click": "kill -RTMIN $(pgrep rstat)",
    "on-click-middle": "kill -RTMIN+1 $(pgrep rstat)"
}
Controls
Default interval is 500ms.
Left-click cycles the update interval: 500ms → 250 → 100 → 2000 → 1000 → 500ms. The 100ms floor is the fastest Waybar can reliably render with GTK -- below that, pipe backpressure throttles output regardless of sample speed.
kill -RTMIN $(pgrep rstat)
--ludicrous bypasses the Waybar limit for terminal use. Sets the sample
interval to 16ms (~60 fps). Pipe to a terminal or TUI that can keep up:
sudo rstat --ludicrous
Kernel mode is enabled by default.
Middle-click toggles kernel inclusion for all relevant sections (CPU,
Memory, IO). The tooltip footer shows the current mode as Kernel included or
Kernel excluded.
kill -RTMIN+1 $(pgrep rstat)
Benchmarking
sudo ./target/release/rstat --bench 200
Runs 200 sample iterations and prints p50/p95/p99 latencies.
Profiling BPF overhead
sudo rstat --profile 10
Measures per-invocation probe latency over 10 seconds and prints a log2
histogram. The probe self-times using bpf_ktime_get_ns() on every context
switch.
Writeup
The full story of how this went from an 800ms shell script to sub-millisecond eBPF: