Monte Carlo Simulations
January 13, 2026 · View on GitHub
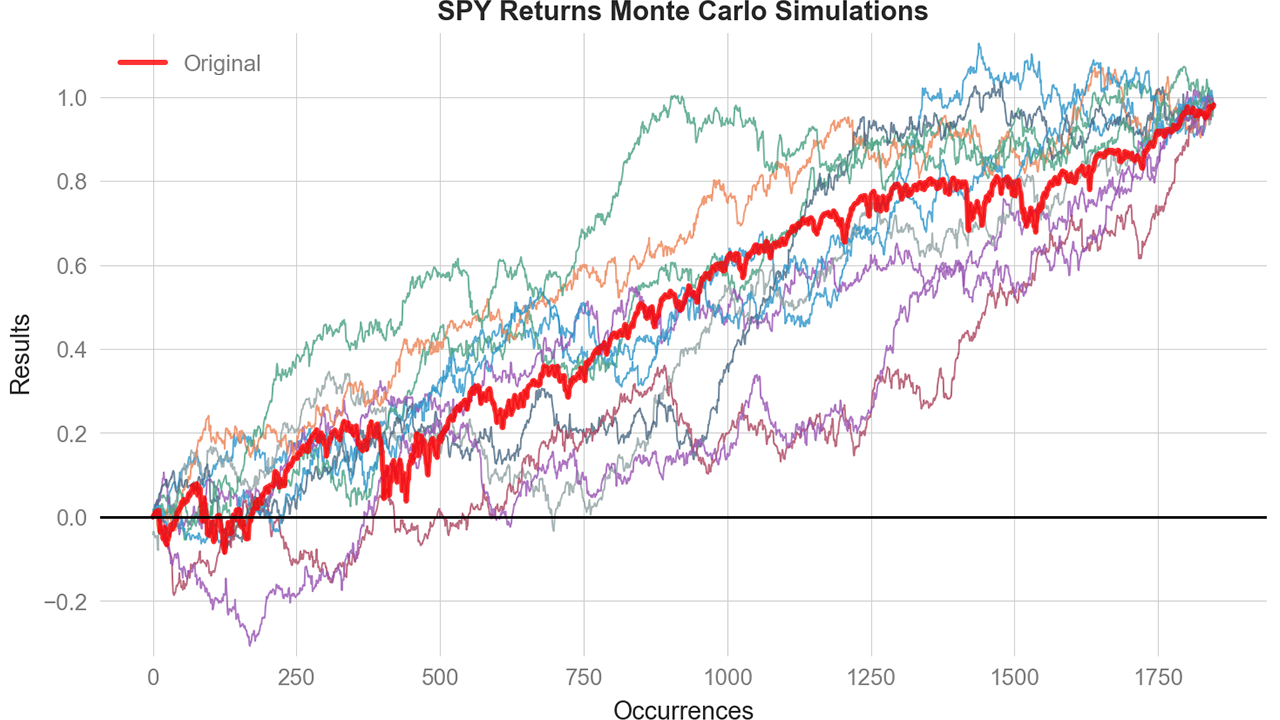
QuantStats includes built-in Monte Carlo simulation capabilities for probabilistic risk analysis. Run thousands of simulations by shuffling historical returns to understand the range of possible outcomes for your strategy.
Quick Start
import quantstats as qs

# fetch daily returns
returns = qs.utils.download_returns('SPY')

# run Monte Carlo simulation with 1000 paths
mc = qs.stats.montecarlo(returns, sims=1000, seed=42)

# view terminal value statistics
print(mc.stats)
Output:
{
    'min': -0.15,
    'max': 0.85,
    'mean': 0.32,
    'median': 0.31,
    'std': 0.18,
    'percentile_5': 0.05,
    'percentile_95': 0.62
}
Bust & Goal Probabilities
Calculate the probability of hitting a drawdown threshold (bust) or reaching a return goal:
# Set bust threshold at -20% drawdown, goal at +50% return
mc = qs.stats.montecarlo(returns, sims=1000, bust=-0.20, goal=0.50, seed=42)

print(f"Probability of bust: {mc.bust_probability:.1%}")
print(f"Probability of reaching goal: {mc.goal_probability:.1%}")
Output:
Probability of bust: 23.4%
Probability of reaching goal: 67.8%
Max Drawdown Distribution
Analyze the distribution of maximum drawdowns across all simulations:
print(mc.maxdd)
Output:
{
    'min': -0.45,      # worst drawdown across all sims
    'max': -0.05,      # best (smallest) drawdown
    'mean': -0.18,
    'median': -0.16,
    'std': 0.08,
    'percentile_5': -0.35,
    'percentile_95': -0.08
}
Confidence Bands
Get confidence intervals for the simulation paths:
# 95% confidence band
lower, upper = mc.confidence_band(0.95)

# specific percentile path
p10 = mc.percentile(10)  # 10th percentile path
p90 = mc.percentile(90)  # 90th percentile path
Visualization
Plot all simulation paths:
qs.plots.montecarlo(returns, sims=500, seed=42)

# or from an existing result
mc.plot()
Plot terminal value distribution:
qs.plots.montecarlo_distribution(returns, sims=500, seed=42)
Pandas Extension
After calling qs.extend_pandas(), you can use Monte Carlo directly on Series:
qs.extend_pandas()

# run simulation directly on a returns Series
mc = returns.montecarlo(sims=1000, bust=-0.15, goal=0.30)

# plot directly
returns.plot_montecarlo(sims=500)
Sharpe, Drawdown & CAGR Distributions
Get distributions of key metrics across simulations:
# Sharpe ratio distribution
sharpe_dist = qs.stats.montecarlo_sharpe(returns, sims=1000)
print(f"Sharpe range: {sharpe_dist['percentile_5']:.2f} to {sharpe_dist['percentile_95']:.2f}")

# Max drawdown distribution
dd_dist = qs.stats.montecarlo_drawdown(returns, sims=1000)
print(f"Drawdown range: {dd_dist['percentile_5']:.1%} to {dd_dist['percentile_95']:.1%}")

# CAGR distribution
cagr_dist = qs.stats.montecarlo_cagr(returns, sims=1000)
print(f"CAGR range: {cagr_dist['percentile_5']:.1%} to {cagr_dist['percentile_95']:.1%}")
Access Raw Data
The raw simulation data is available as a DataFrame:
print(mc.data.head())
         sim_0     sim_1     sim_2     sim_3     sim_4  ...
0     0.000000  0.017745 -0.002586 -0.005346 -0.042107  ...
1     0.002647  0.017795 -0.002398  0.004795 -0.034664  ...
2     0.003351  0.020711  0.002926  0.004868 -0.037902  ...
3     0.007572  0.029275  0.004323  0.012818 -0.044294  ...
4     0.010900  0.028764  0.009446  0.026309 -0.049399  ...
How It Works
Monte Carlo simulation in QuantStats uses return shuffling:
- Take your historical returns
- Randomly shuffle the order of returns (preserving the distribution)
- Calculate cumulative returns for each shuffled path
- Repeat for N simulations
This approach:
- Preserves the exact return distribution of your data
- Breaks any time-series dependencies (autocorrelation)
- Shows the range of outcomes if returns occurred in different orders
- Helps quantify luck vs. skill in your strategy's performance
Note: Because shuffling preserves the product of all (1+r) values, the terminal value is the same across all simulations. What differs is the path taken to get there, which affects drawdowns, Sharpe ratios, and other path-dependent metrics.
API Reference
qs.stats.montecarlo(returns, sims=1000, bust=None, goal=None, seed=None)
Run Monte Carlo simulation on returns.
Parameters:
returns: pd.Series of daily returnssims: Number of simulations (default: 1000)bust: Drawdown threshold for bust probability (e.g., -0.20)goal: Return threshold for goal probability (e.g., 0.50)seed: Random seed for reproducibility
Returns: MonteCarloResult object
MonteCarloResult properties
| Property | Description |
|---|---|
data | DataFrame with all simulation paths |
original | Series with original cumulative returns |
stats | Dict with terminal value statistics |
maxdd | Dict with max drawdown statistics |
bust_probability | Float (if bust threshold set) |
goal_probability | Float (if goal threshold set) |
MonteCarloResult methods
| Method | Description |
|---|---|
percentile(p) | Get p-th percentile path |
confidence_band(level) | Get (lower, upper) confidence bounds |
plot(**kwargs) | Plot simulation paths |