QlikView Magnetic Field Visualization
January 6, 2014 · View on GitHub
This QlikView document contains an example of visualizing events that occur in relation to the alignment of Earth's magnetic field. Using 2 radar charts, each event is plotted against it's relation to Earth's axis. The mean and 95% confidence interval of the sample data is also plotted.
This visualization is based on the study "Dog's are sensitive to small variations of the Earth's magnetic field" published in Frontiers of Zoology, where the following graph was used to illustrate how dogs align their bodies with the magnetic field while urinating and defecating:
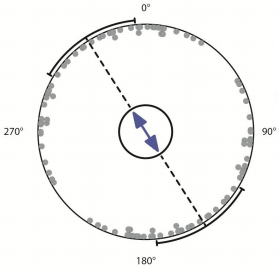
The result in QlikView, using random data:
