D3CalendarView Qlikview Extension
February 6, 2014 · View on GitHub
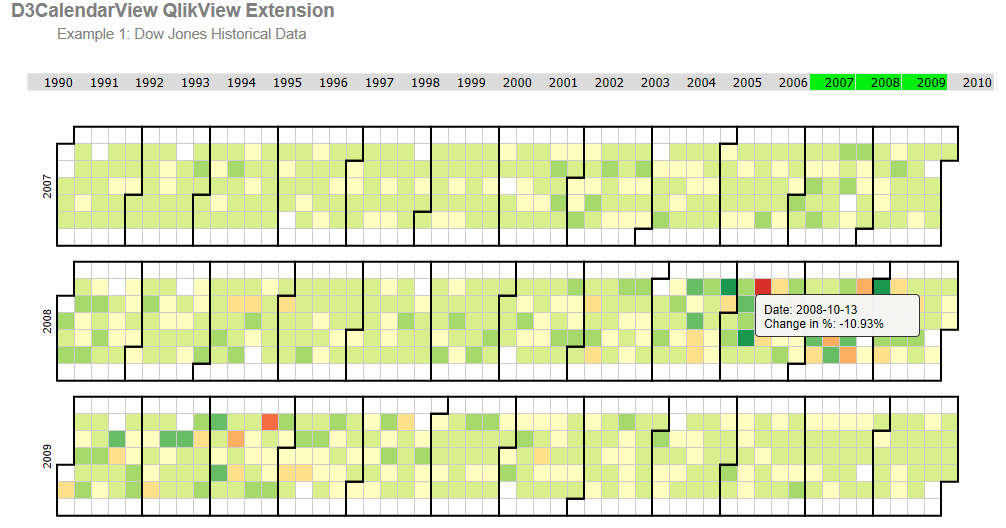
Use this QlikView Extension is the perfect choice if you want to display a lot of data on a day-per-day basis. The data passed to the extension is displayed in a diverging color scale. The values are visualized as colored cells per day. Days are arranged into columns by week, then grouped by month and years.
Screenshots
D3CalendarView QlikView Extension in Action:

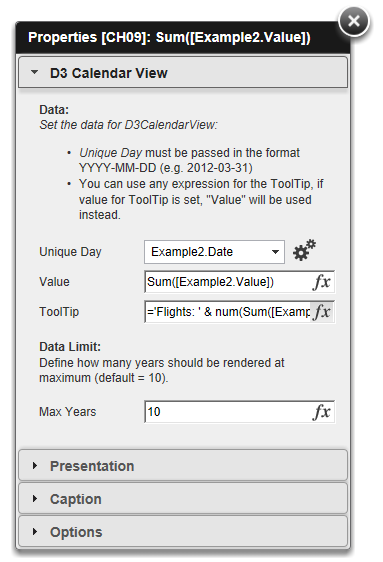
Configuration Dialog:
Installation & Configuration
Installation of the QlikView Extension is straightforward, there is nothing special to take care of:
- Download the extension + Sample QlikView application
- Install the extension on your local computer (doubleclick the .qar file)
- Drag’n’Drop the extension within QlikView Desktop (using WebView)
- Finally deploy the extension to your server (→ detailed instruction)
Configuration
The table below explains the properties available for configuring the behavior of this extension:
| Property | Type | Description |
|---|---|---|
| Unique Day | Date | Format: YYYY-MM-DD |
| Value | Numeric | Numeric value for the given day |
| ToolTip | String | String value to be used by the ToolTip |
| Max Years | Integer | Limit the years to be rendered (default = 10) |
Additional Information
Compatibility
Tested and developed for the following systems:
- Windows 7, Windows 8, Windows 2012
- You'll need a modern browser which supports SVG
- QlikView 11 SR2+, QlikView 11.2
Change Log
- See Change Log
Possible Improvements
- Implement different color schemas
- Currently you can only select a single day, I could imagine that it would be helpful to select also weeks and months
- Display a color-legend
License
The software is made available "AS IS" without any warranty of any kind under the MIT License (MIT). Since this is a private project QlikTech support agreement does not cover support for this software.