README.org
April 25, 2026 · View on GitHub
#+title: Dape - Debug Adapter Protocol for Emacs #+author: Daniel Pettersson #+property: header-args :results silent #+language: en
#+html: 
=Dape= is a debug adapter client for Emacs. The debug adapter protocol, much like its more well-known counterpart, the language server protocol, aims to establish a common API for programming tools. However, instead of functionalities such as code completions, it provides a standardized interface for debuggers.
To begin a debugging session, invoke the dape command. In the minibuffer prompt, enter a debug adapter configuration name from dape-configs.
For complete functionality, make sure to enable eldoc-mode in your source buffers and repeat-mode for more pleasant key mappings.
- Features
- Batteries included support (
describe-variabledape-configs) - Log breakpoints
- Conditional breakpoints
- Variable explorer
- Variable watch
- Variable hover with
eldoc - REPL
- gdb-mi.el like interface
- Memory editor with
hexl - Disassembly viewer
- Integration with
compile - Debug adapter configuration ergonomics
- No external dependencies outside of core Emacs
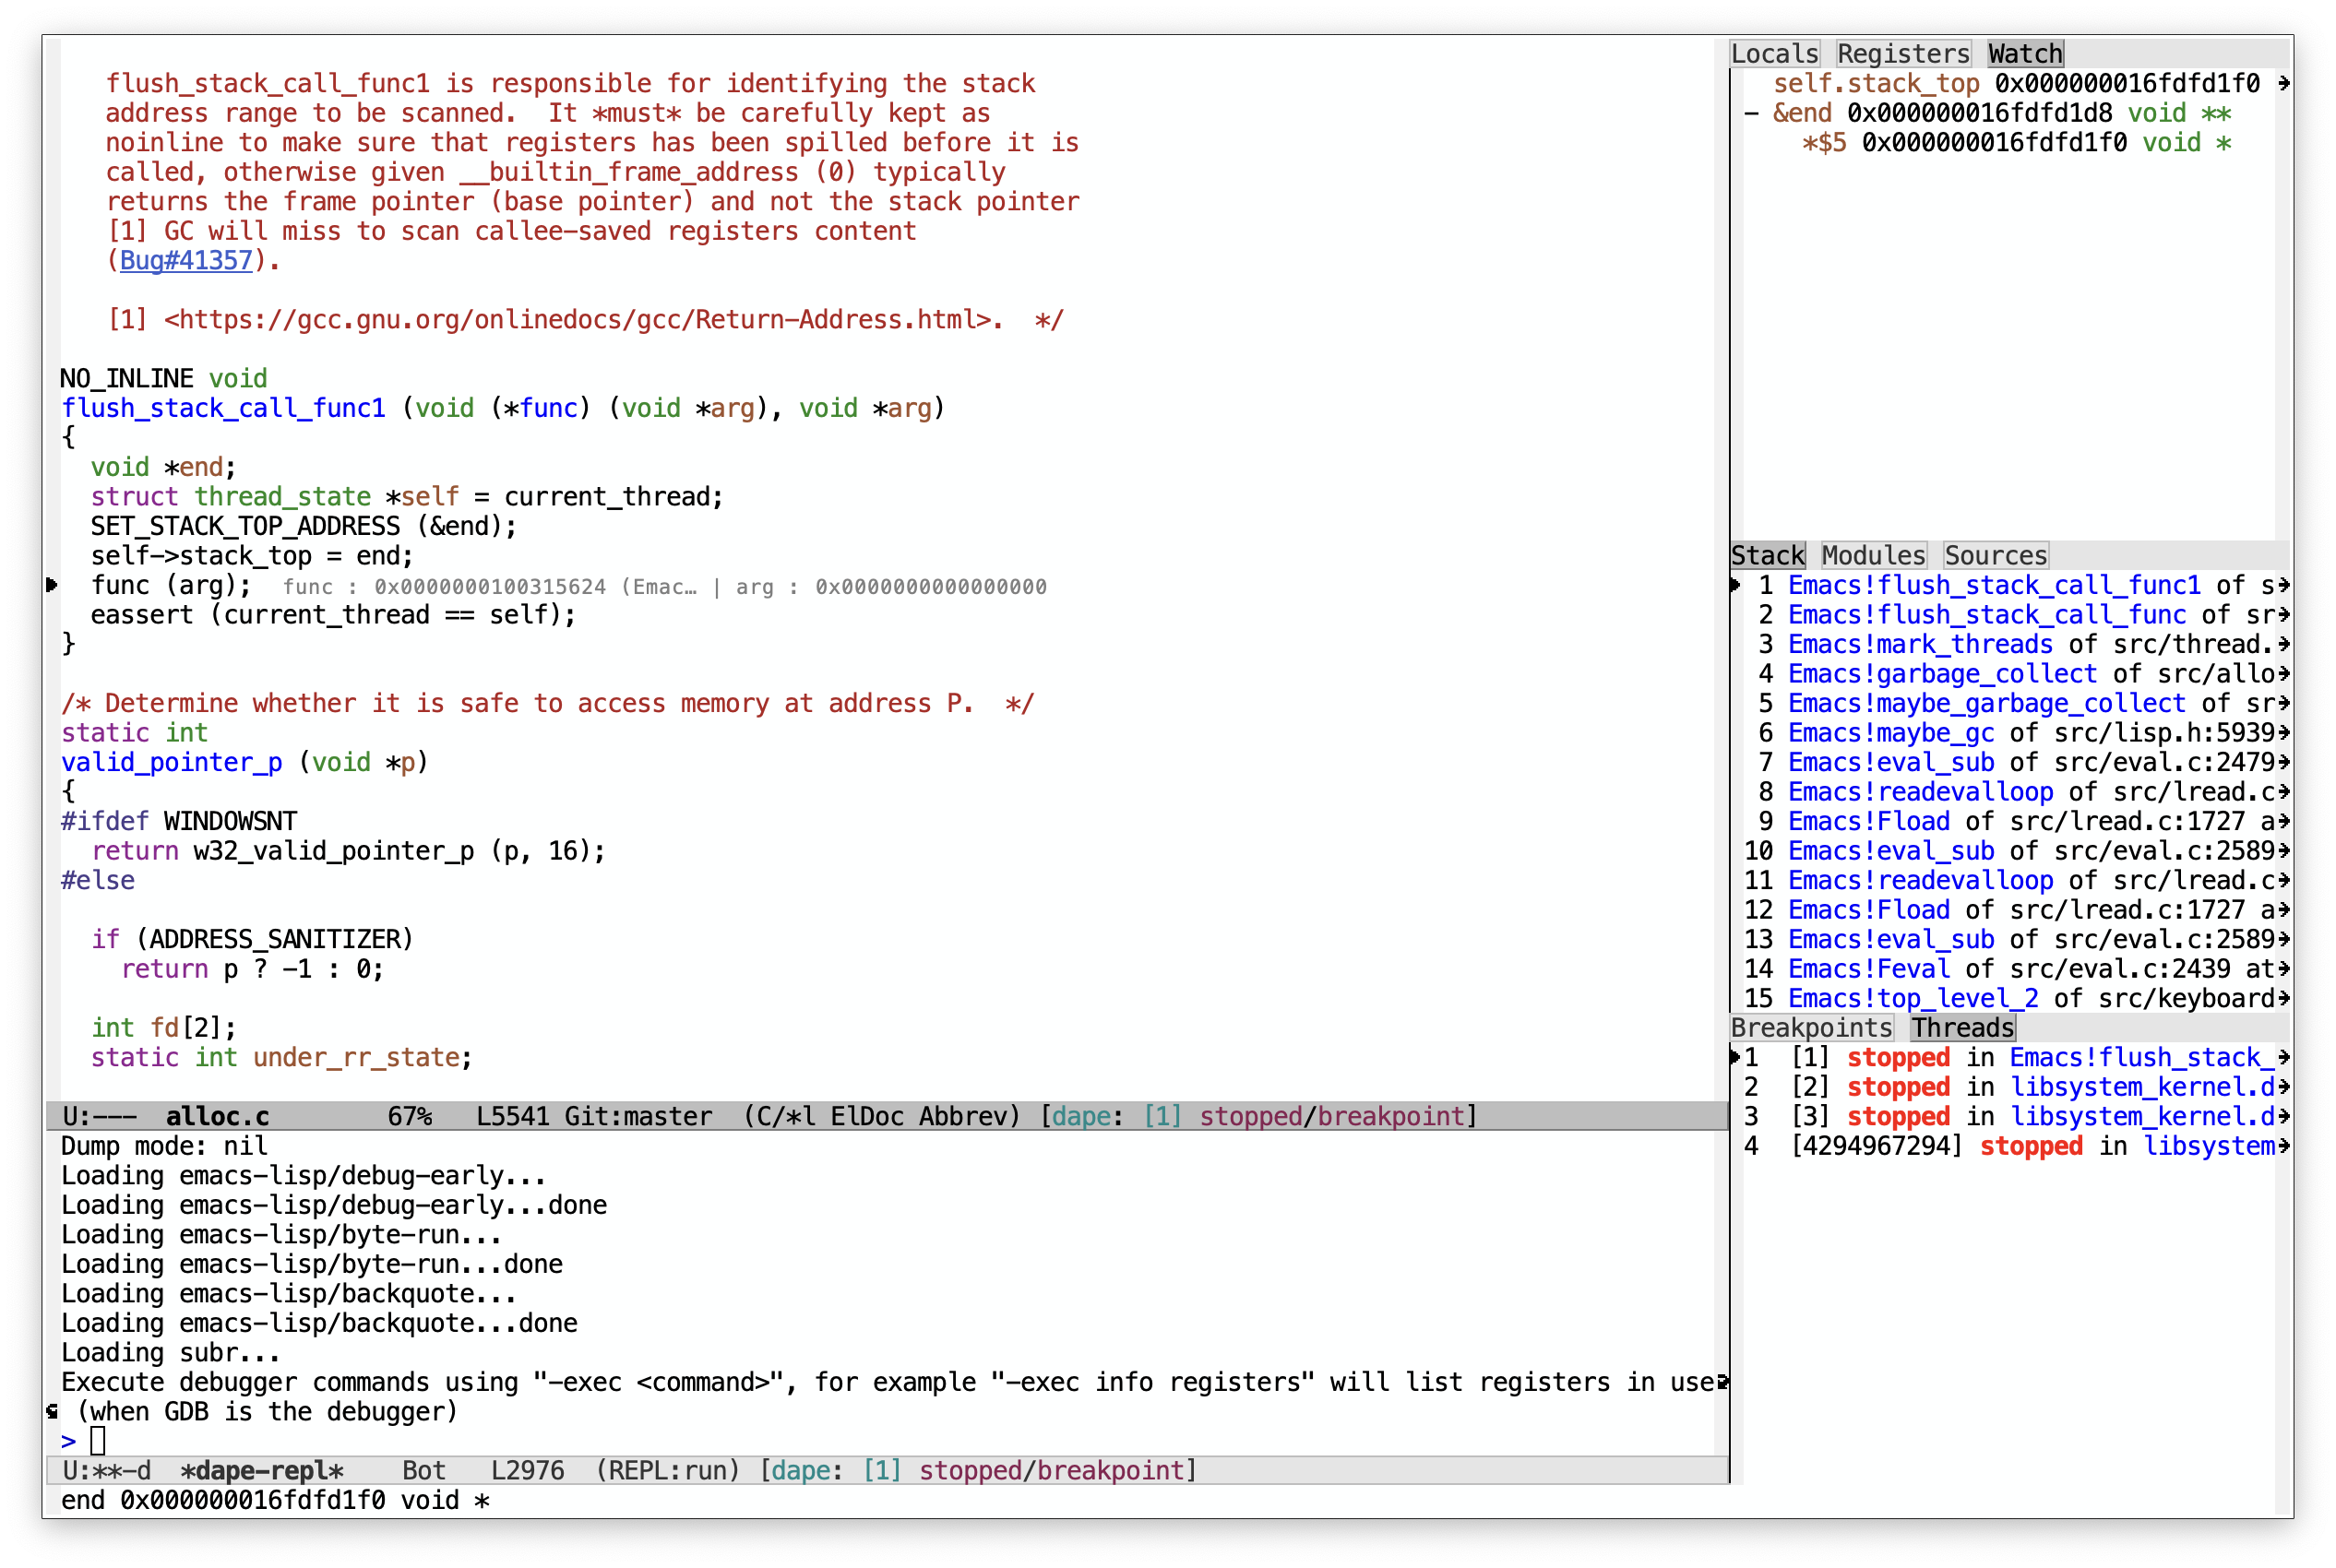
With (setq dape-buffer-window-arrangement 'right):
[[https://raw.githubusercontent.com/svaante/dape/resources/right_0_25_0.png]]
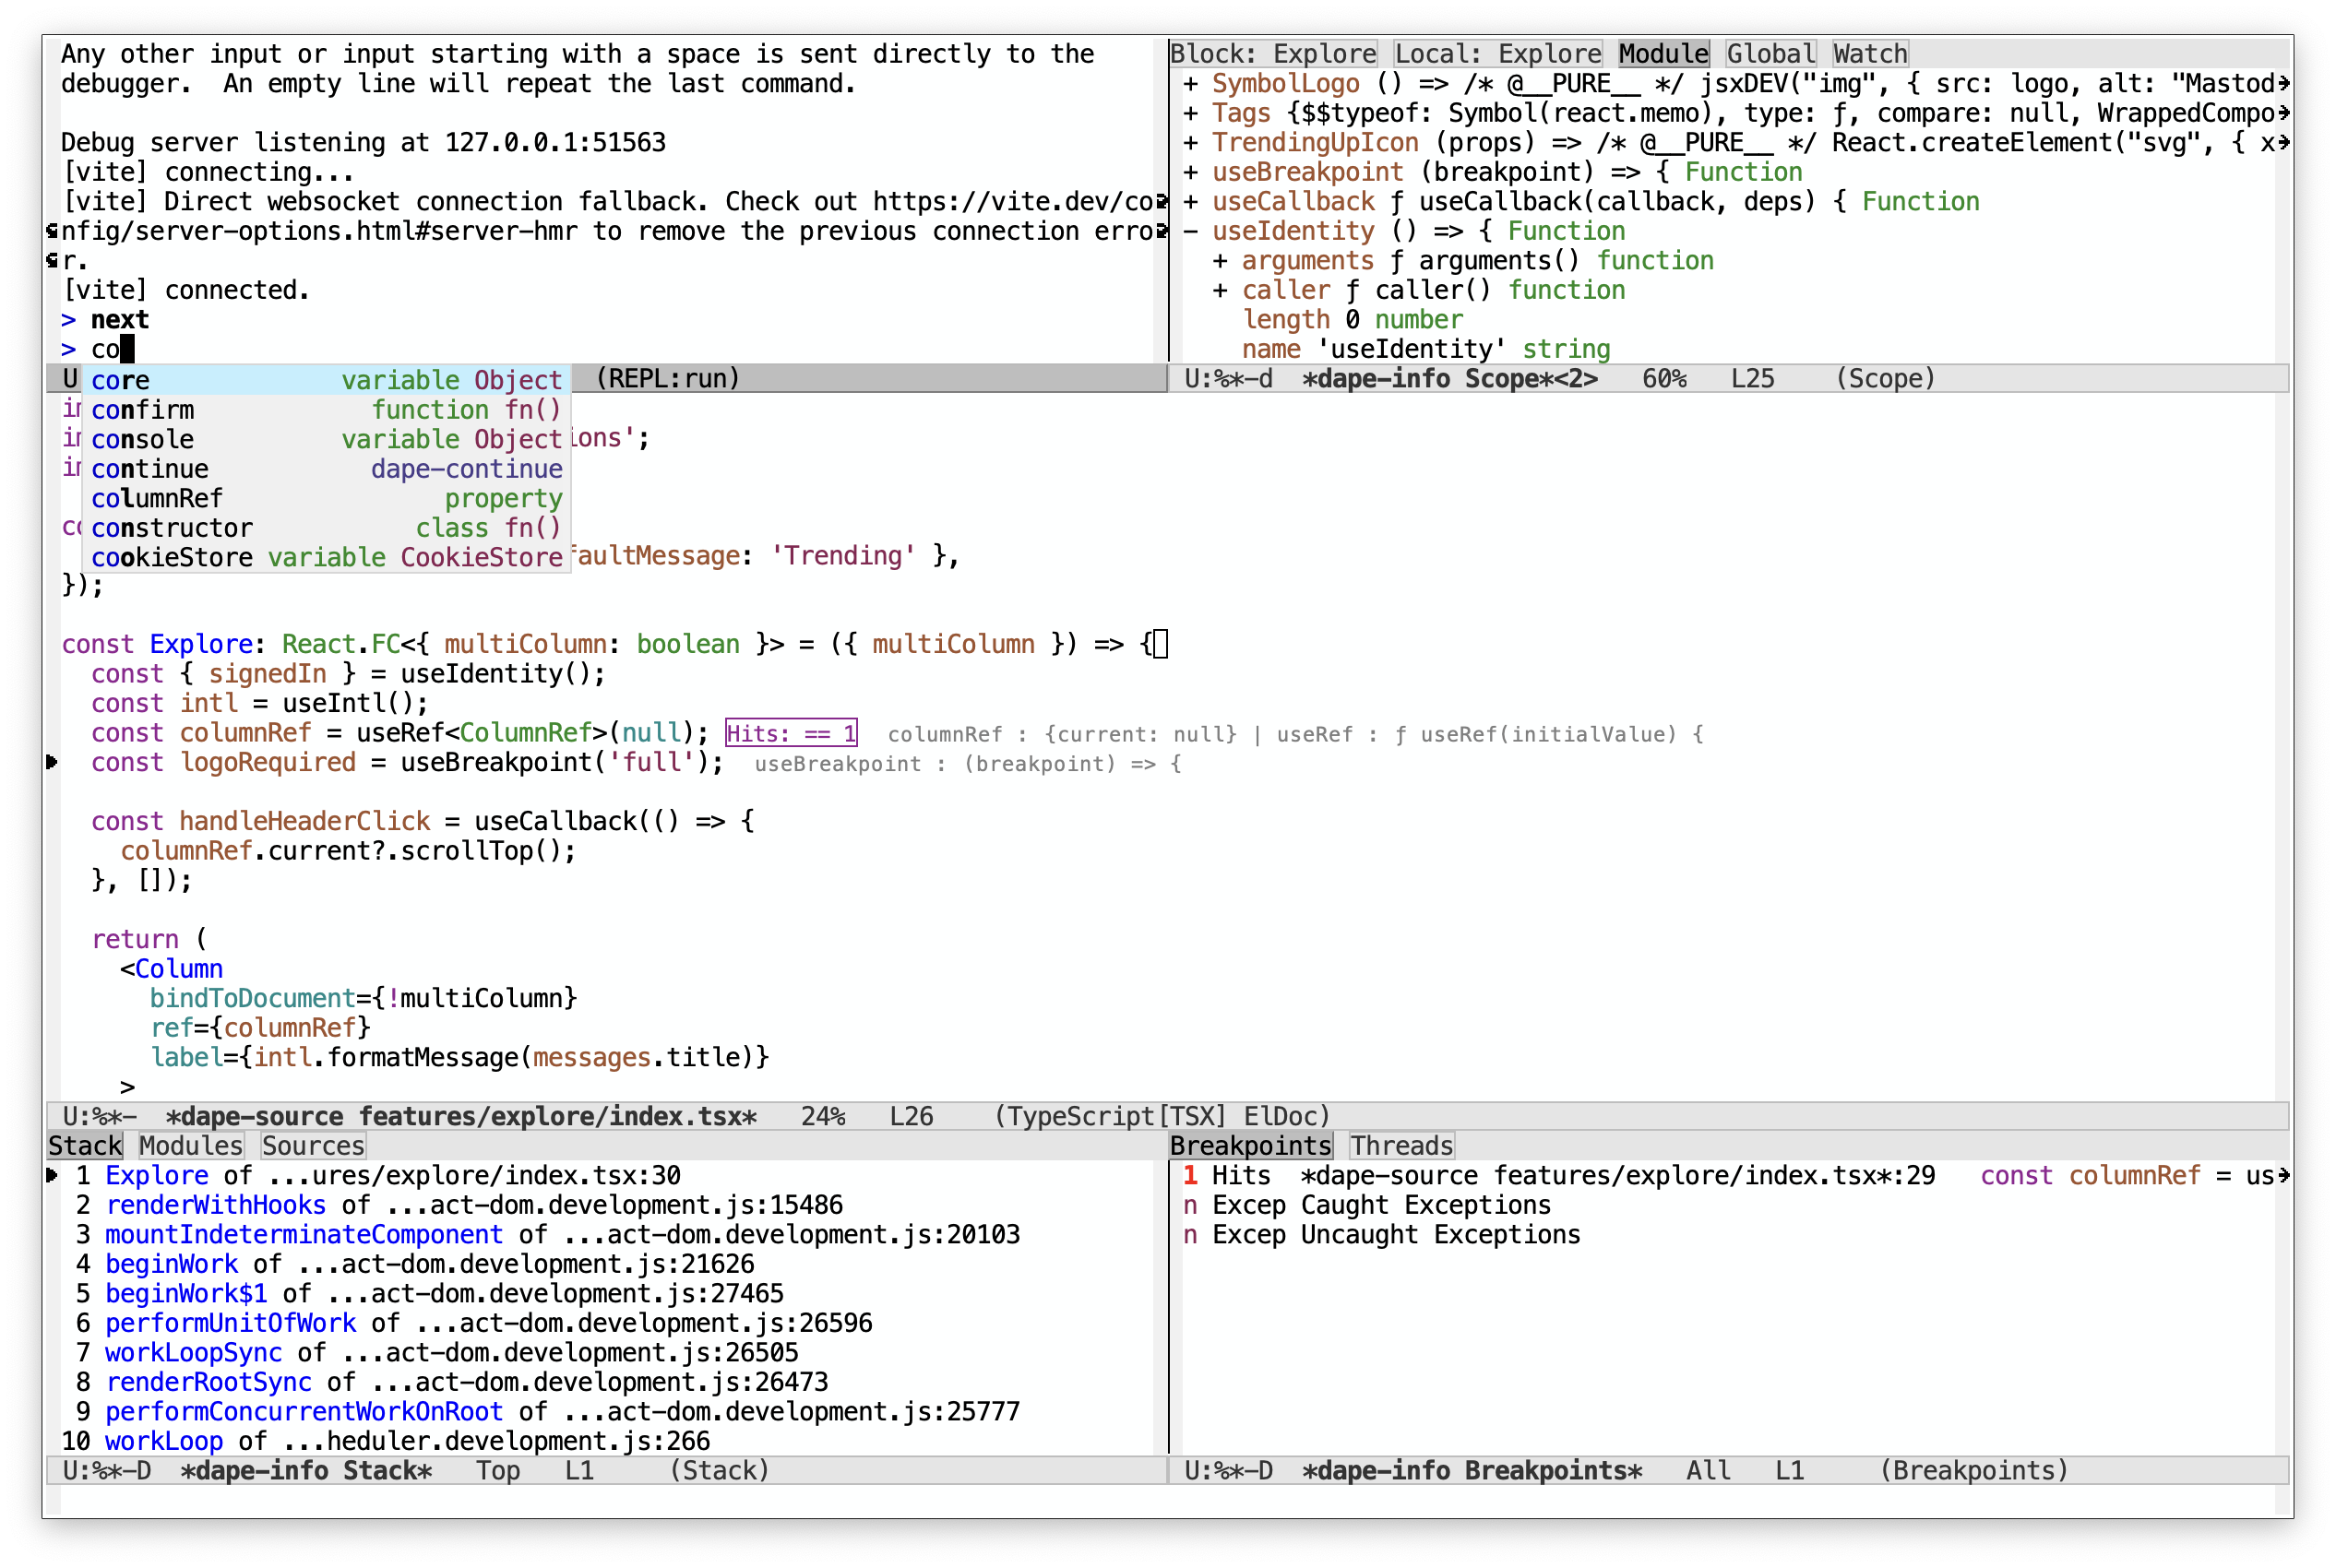
And with (setq dape-buffer-window-arrangement 'gud) + =corfu= as completion-in-region-function:
[[https://raw.githubusercontent.com/svaante/dape/resources/gud_0_25_0.png]]
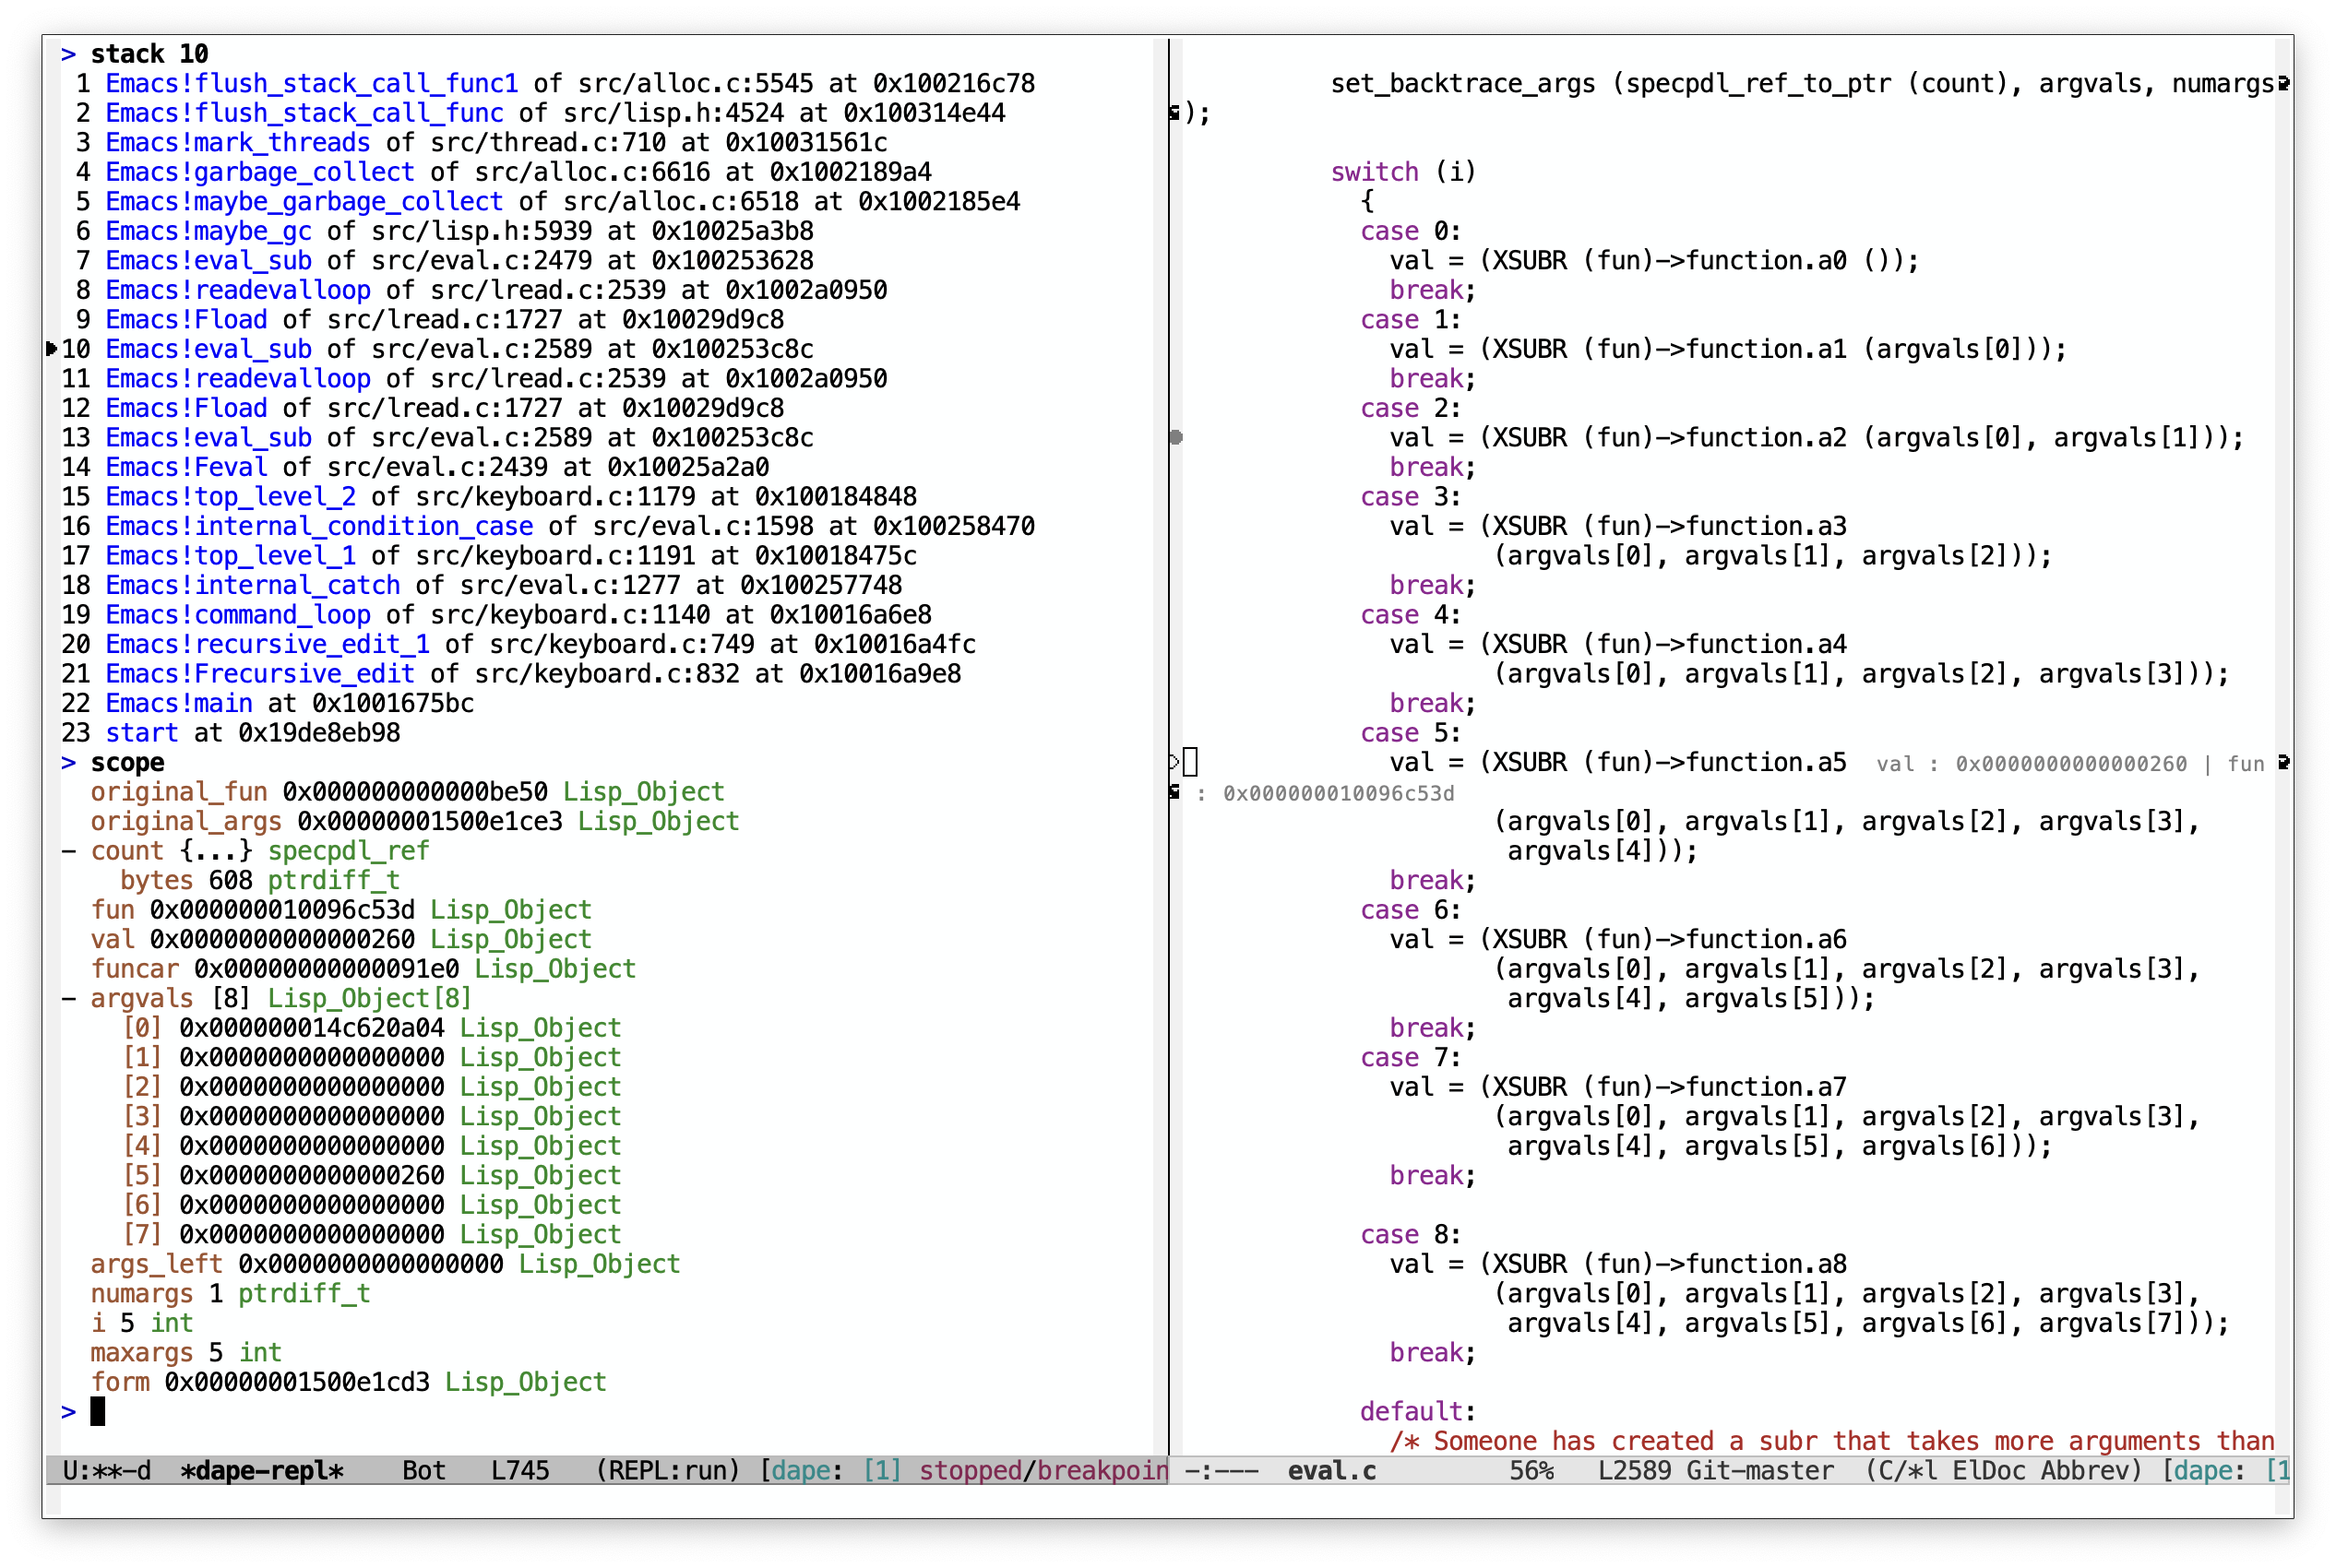
With "rich" REPL output:
[[https://raw.githubusercontent.com/svaante/dape/resources/repl_0_25_0.png]]
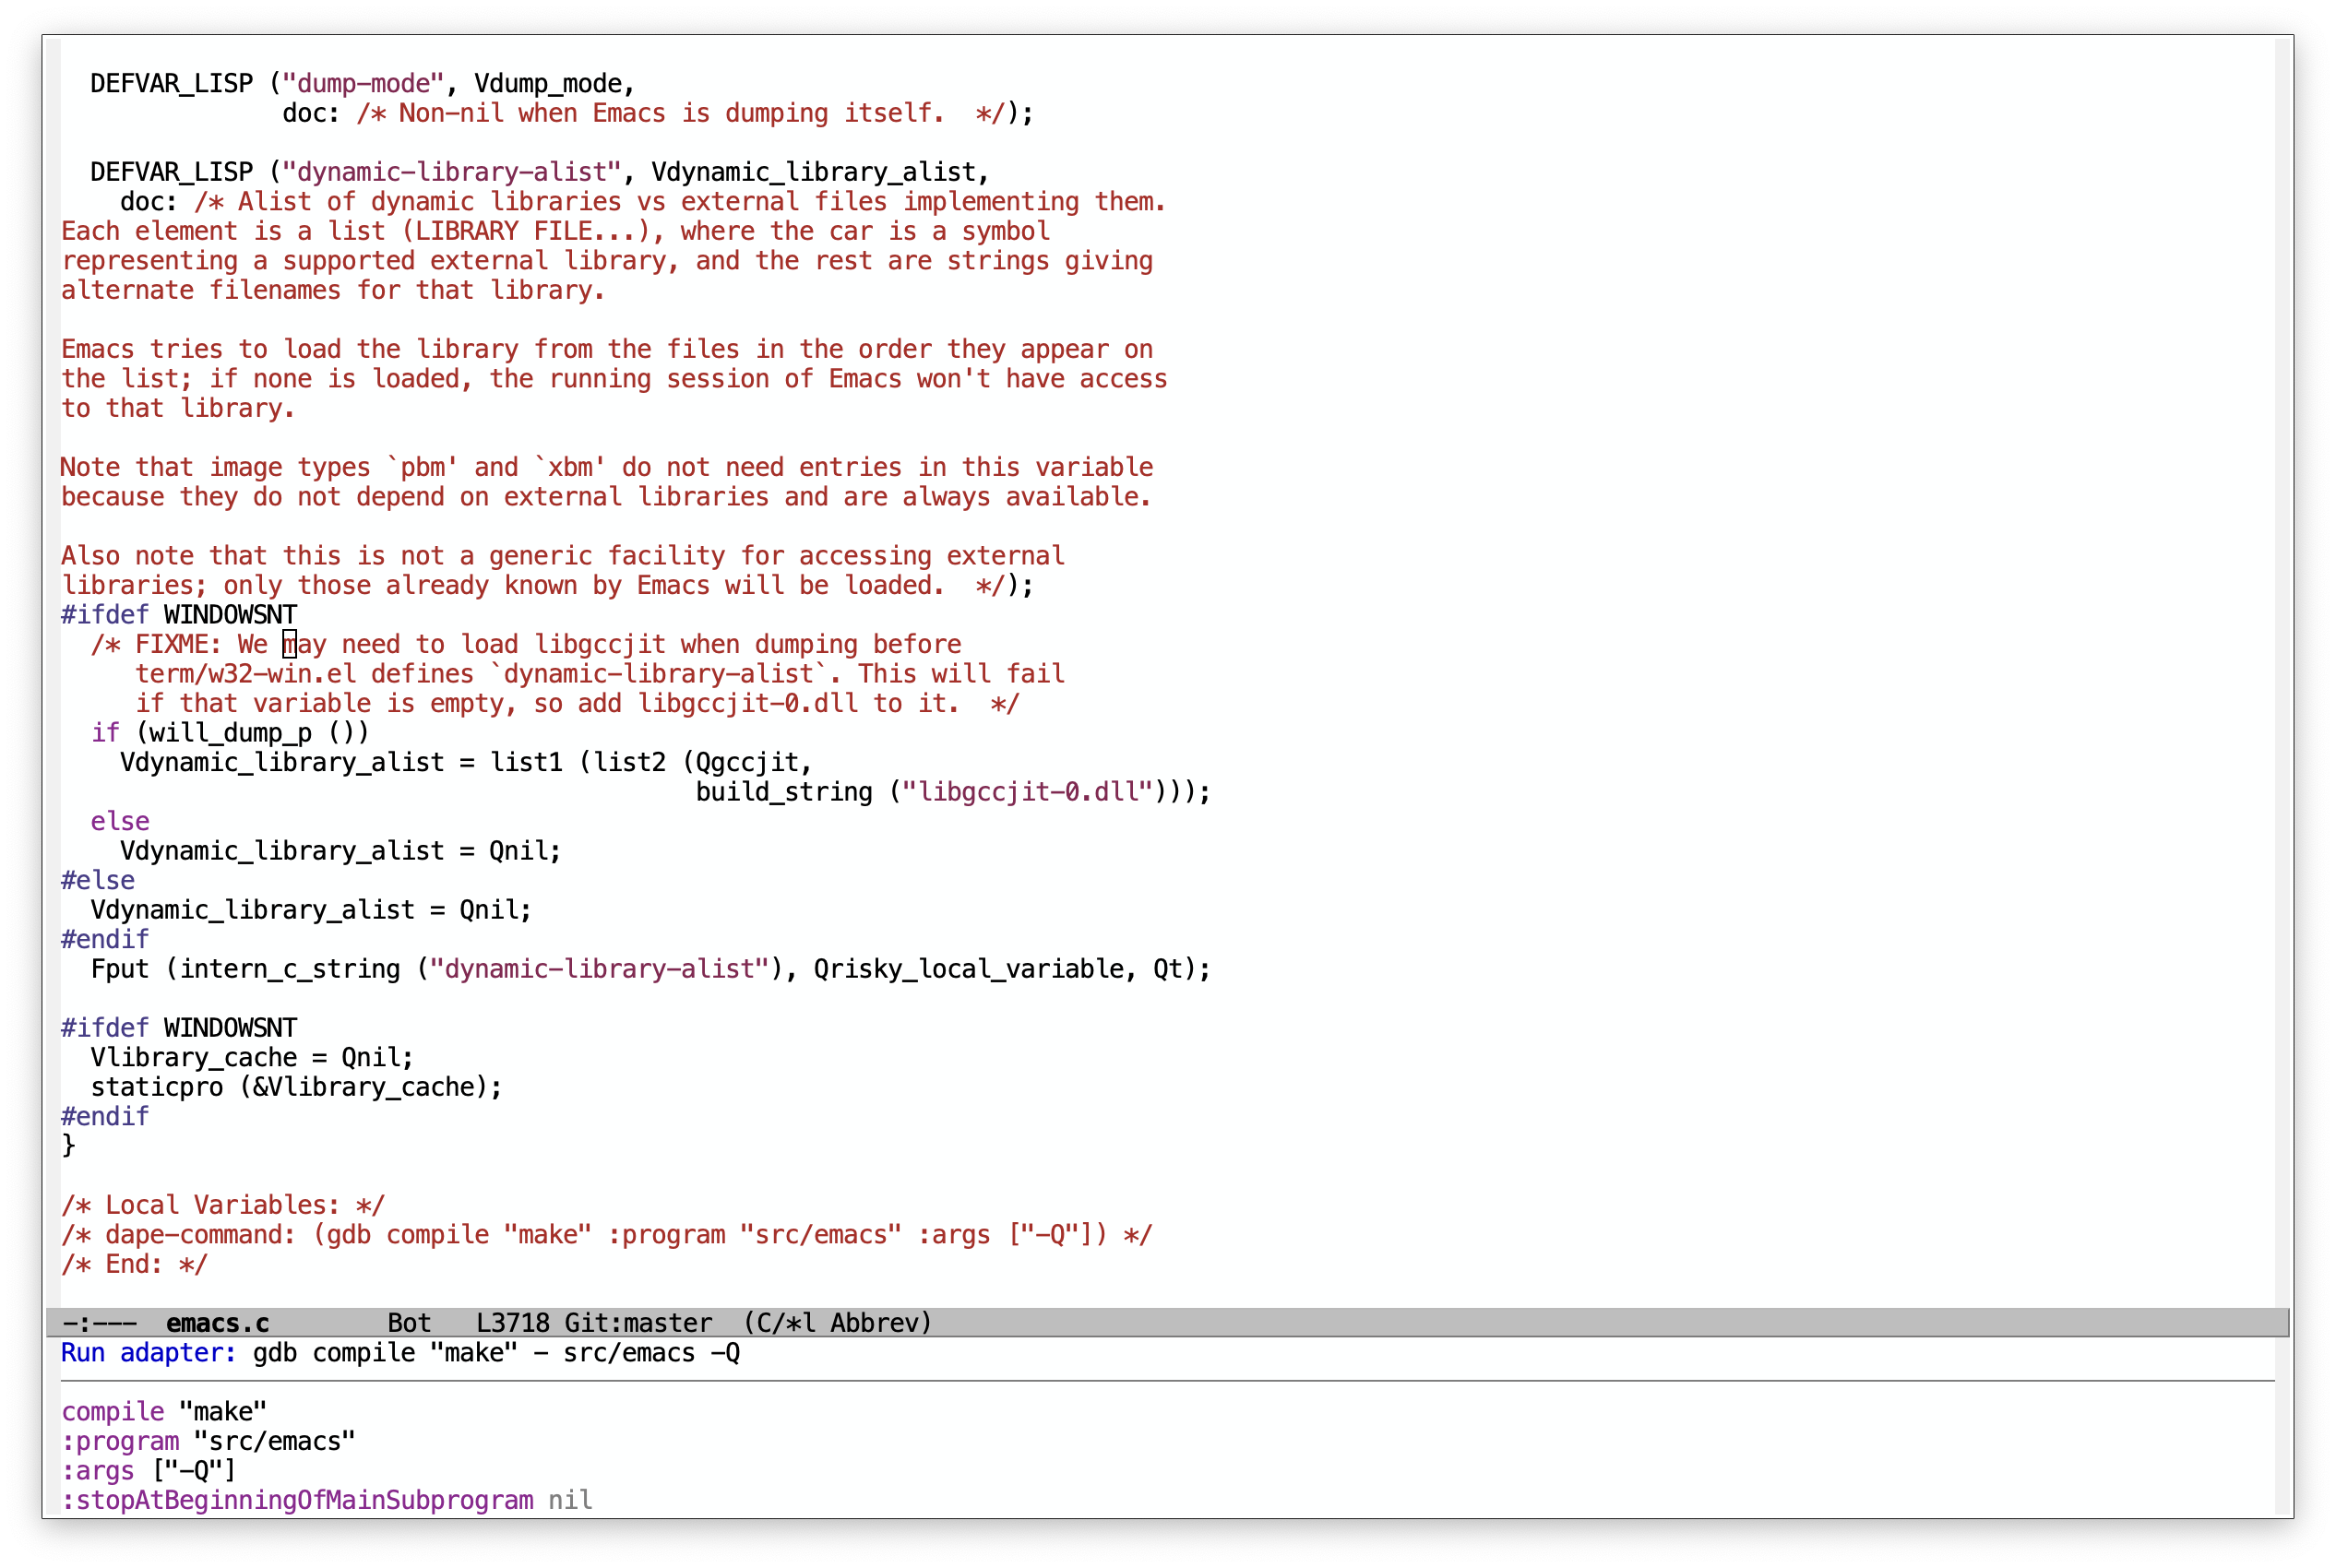
With =minibuffer= adapter configuration hints:
[[https://raw.githubusercontent.com/svaante/dape/resources/minibuffer_0_25_0.png]]
- Configuration
=Dape= includes pre-defined debug adapter configurations for various programming languages. Refer to
dape-configsfor more details. If =dape= doesn't include a configuration suitable for your needs, you can implement your own.
#+begin_src emacs-lisp (use-package dape :preface ;; By default dape shares the same keybinding prefix as `gud' ;; If you do not want to use any prefix, set it to nil. ;; (setq dape-key-prefix "\C-x\C-a")
:hook
;; Save breakpoints on quit
;; (kill-emacs . dape-breakpoint-save)
;; Load breakpoints on startup
;; (after-init . dape-breakpoint-load)

:custom
;; Turn on global bindings for setting breakpoints with mouse
;; (dape-breakpoint-global-mode +1)

;; Info buffers to the right
;; (dape-buffer-window-arrangement 'right)
;; Info buffers like gud (gdb-mi)
;; (dape-buffer-window-arrangement 'gud)
;; (dape-info-hide-mode-line nil)

;; Projectile users
;; (dape-cwd-function #'projectile-project-root)

:config
;; Pulse source line (performance hit)
;; (add-hook 'dape-display-source-hook #'pulse-momentary-highlight-one-line)

;; Save buffers on startup, useful for interpreted languages
;; (add-hook 'dape-start-hook (lambda () (save-some-buffers t t)))

;; Kill compile buffer on build success
;; (add-hook 'dape-compile-hook #'kill-buffer)
)
;; For a more ergonomic Emacs and `dape' experience (use-package repeat :custom (repeat-mode +1))
;; Left and right side windows occupy full frame height (use-package emacs :custom (window-sides-vertical t)) #+end_src
- Differences with dap-mode Dape has no dependencies outside of core Emacs packages, and tries to use get as much out of them possible.
Dape takes a slightly different approach to configuration.
- =Dape= does not support
launch.jsonfiles, if per project configuration is needed usedir-localsanddape-command. - =Dape= enhances ergonomics within the minibuffer by allowing users to modify or add PLIST entries to an existing configuration using options. For example
dape-config :cwd default-directory :program "/home/user/b.out" compile "gcc -g -o b.out main.c". - No magic, no special variables like =${workspaceFolder}=. Instead, functions and variables are resolved before starting a new session.
- Tries to envision how debug adapter configurations would be implemented in Emacs if vscode never existed.
- Supported debug adapters In theory all debug adapters should be compatible with =Dape=.
** Javascript - vscode-js-*
- Install =node=
- Visit https://github.com/microsoft/vscode-js-debug/releases/ and download the asset =js-debug-dap-
.tar.gz= - Unpack ~mkdir -p ~/.emacs.d/debug-adapters && tar -xvzf js-debug-dap-
.tar.gz -C /.emacs.d/debug-adapters
For more information see [[https://github.com/microsoft/vscode-js-debug/blob/main/OPTIONS.md][OPTIONS.md]].
** Go - dlv See [[https://github.com/go-delve/delve/tree/master/Documentation/installation][delve installation]]. For more information see [[https://github.com/go-delve/delve/blob/master/Documentation/usage/dlv_dap.md][documentation]].
** C, C++, Rust, and more - GDB Ensure that your GDB version is 14.1 or newer. For further details, consult the [[https://sourceware.org/gdb/current/onlinedocs/gdb.html/Debugger-Adapter-Protocol.html][documentation]].
** C and C++ - cpptools Download latesnd unpack =vsix= file with your favorite unzipper.
- Download latest =vsix= [[https://github.com/microsoft/vscode-cpptools/releases][release]] for your platform =cpptools-
- .vsix= - Unpack ~mkdir -p ~/.emacs.d/debug-adapters && unzip cpptools-
- .vsix -d /.emacs.d/debug-adapters/cpptools - Then ~chmod +x
/.emacs.d/debug-adapters/cpptools/extension/debugAdapters/bin/OpenDebugAD7 - And ~chmod +x
/.emacs.d/debug-adapters/cpptools/extension/debugAdapters/lldb-mi/bin/lldb-mi
See [[https://code.visualstudio.com/docs/cpp/launch-json-reference][options]].
** C, C++ and Rust - lldb-dap
- Install [[https://github.com/helix-editor/helix/wiki/Debugger-Configurations#install-debuggers][lldb-dap]] for your platform
*** Example for MacOS using homebrew
- Install the =llvm= keg: =brew install llvm=
- Prepend the =llvm= path to the =PATH= variable (=$(brew --prefix --installed llvm)/bin=)
- =M-x dape= and pass in arguments of interest
- To pass arguments, use =:args ["arg1" "arg2" ..]=
- To pass environment variables, use =:env (:RUST_LOG "WARN" :FOO "BAR")=
- To use a different program instead of =a.out= (e.g., for Rust), use =:program "target/debug/<crate_name>"=
** Python - debugpy
Install debugpy with pip pip install debugpy
See [[https://github.com/microsoft/debugpy/wiki/Debug-configuration-settings][options]].
** Godot Configure debug adapter port under "Editor" > "Editor Settings" > "Debug Adapter".
** Dart - flutter See for installation https://docs.flutter.dev/get-started/install
** C# - netcoredbg See https://github.com/Samsung/netcoredbg for installation
** Ruby - rdbg
Install with gem install debug.
See https://github.com/ruby/debug for more information
** Java - JDTLS with Java Debug Server plugin
See https://github.com/eclipse-jdtls/eclipse.jdt.ls for installation of JDTLS.
See https://github.com/microsoft/java-debug for installation of the Java Debug Server plugin.
The Java config depends on Eglot running JDTLS with the plugin prior to starting Dape.
Either globally extend eglot-server-programs as follows to have JDTLS always load the plugin:
#+begin_src emacs-lisp
(add-to-list 'eglot-server-programs
'((java-mode java-ts-mode) .
("jdtls"
:initializationOptions
(:bundles ["/PATH/TO/java-debug/com.microsoft.java.debug.plugin/target/com.microsoft.java.debug.plugin-VERSION.jar"]))))
#+end_src
Alternatively, set the variable eglot-workspace-configuration in the file =.dir-locals.el= in a project's root directory, to have JDTLS load the plugin for that project:
#+begin_src emacs-lisp
;; content of /project/.dir-locals.el
((nil . ((eglot-workspace-configuration
. (:jdtls (:initializationOptions
(:bundles ["/PATH/TO/java-debug/com.microsoft.java.debug.plugin/target/com.microsoft.java.debug.plugin-VERSION.jar"])))))))
#+end_src
** PHP - Xdebug
- Install and setup =Xdebug= see [[https://github.com/xdebug/vscode-php-debug][instructions]]
- Install =node=
- Download latest =vsix= [[https://github.com/xdebug/vscode-php-debug/releases][release]] of DAP adapter for =Xdebug= =php-debug-
.vsix= - Unpack ~mkdir -p ~/.emacs.d/debug-adapters && unzip php-debug-
.vsix -d /.emacs.d/debug-adapters/php-debug
** OCaml - ocamlearlybird
Install with opam install earlybird.
- Point =:program= to bytecode file
- Place breakpoints inside of =_build/default/*=
See [[https://github.com/hackwaly/ocamlearlybird][ocamlearlybird]] for more information.
** Bash - bash-debug
- Install =node=
- Download latest =vsix= [[https://github.com/rogalmic/vscode-bash-debug/releases][release]] of DAP adapter =bash-debug-
.vsix= - Unpack ~mkdir -p ~/.emacs.d/debug-adapters && unzip bash-debug-
.vsix -d /.emacs.d/debug-adapters/bash-debug
See [[https://github.com/rogalmic/vscode-bash-debug][bash-debug]] for more information.
** Other untested adapters If you find a working configuration for any other debug adapter please submit a PR.
See [[https://microsoft.github.io/debug-adapter-protocol/implementors/adapters/][microsofts list]] for other adapters, your mileage will vary.
- Contribute =dape= is subject to the same copyright assignment policy as GNU Emacs.
Any legally [[https://www.gnu.org/prep/maintain/html_node/Legally-Significant.html#Legally-Significant][significant]] contributions can only be merged after the author has completed their paperwork. See [[https://www.fsf.org/licensing/contributor-faq][Contributor's Frequently Asked Questions (FAQ)]] for more information.
- Performance
Some minor gains to performance in the debugger can be achieved in changing Emacs configuration values for process interaction and garbage collection.
** =gc-cons-threshold=
This variable controls the frequency of garbage collection in Emacs. Too high a value will lead to increased system memory pressure and longer stalls, and too low a value will result in extra interruptions and context switches (poor performance).
According to [[https://www.reddit.com/r/emacs/comments/brc05y/comment/eofulix/][GNU Emacs Maintainer Eli Zaretskii]]:
: My suggestion is to repeatedly multiply gc-cons-threshold by 2 until you stop seeing significant improvements in : responsiveness, and in any case not to increase by a factor larger than 100 or somesuch. If even a 100-fold increase : doesn't help, there's some deeper problem with the Lisp code which produces so much garbage, or maybe GC is not the : reason for slowdown.
Abiding the upper end of that advice, you can try to set =gc-cons-threshold= to 100x the original value:
#+begin_src elisp (setq gc-cons-threshold 80000000) ;; original value * 100 #+end_src
** =read-process-output-max=
The default =read-process-output-max= of 4096 bytes may inhibit performance to some degree, also.
*** Linux
On Linux, you should be able to set it up to about =1mb=. To check the max value, check the output of:
#+begin_src sh cat /proc/sys/fs/pipe-max-size #+end_src
To set it:
#+begin_src elisp (setq read-process-output-max (* 1024 1024)) ;; 1mb #+end_src
*** Mac OS
For Mac OS, there isn't an easy way to see the operating system pipe-max-size. It's probably about =64kb=.
#+begin_src elisp (setq read-process-output-max (* 64 1024)) ;; 64k #+end_src
*** Windows
There doesn't seem to be a limit for Windows. You can try =1mb=.
#+begin_src elisp (setq read-process-output-max (* 1024 1024)) ;; 1mb #+end_src
-
Bugs and issues Before reporting any issues
(setq dape-debug t)and take a look at =dape-repl= buffer. Please share your =dape-repl= and =dape-connection events= in the buffer contents with the bug report. The =master= branch is used as an development branch and releases on elpa should be more stable so in the mean time use elpa if the bug is a breaking you workflow. -
Acknowledgements Big thanks to João Távora for the input and jsonrpc; the project wouldn't be where it is without João.