Real-Time Performance
September 20, 2026 · View on GitHub
Canonical record of the on-device and host profiling behind the Ultralytics YOLO iOS SDK's camera and Core ML configuration. Each section is a self-contained experiment: the question, the empirical result, and the conclusion. Use it as the starting point and baseline for future performance work.
Important
Host benchmarks predict the wrong winner — always confirm on device. Mac coremltools predict deltas are useful for quick relative screening, but two separate findings below (end2end head, compute units) flipped or vanished when measured on an actual iPhone. Treat host numbers as hypotheses; treat the Xcode Core ML Performance Report and an instrumented on-device build as ground truth.
📱 Test Setup
- Device (ground truth): iPhone 17 Pro with 12 GB memory and iOS 26.5.2. Its A19 Pro has a 6-core CPU (2 Performance and 4 Efficiency cores), 6-core GPU with Neural Accelerators, and 16-core Neural Engine.
- Host (relative screening only): Apple M4 Pro,
coremltools. - Current model standard:
yolo26nper task fromv8.3.0, int8 Core ML: 224×224 for classify and 640×640 for every other task. - Camera-pipeline measurements below are EMA-smoothed steady-state; the backend table is a single-image burst sweep.
📊 Core ML Backend Benchmark
End-to-end predictOnImage speeds for the standardized YOLO26n INT8 Core ML assets on the test device, as total
time with the preprocess / inference / postprocess split beneath each value. Annotation drawing is excluded. On
iOS, Vision performs input scaling inside the inference request, so preprocess is reported as 0 and its cost is
included in inference.
| Model | Task | size (pixels) | CPU Core ML .cpuOnly(ms) | CPU + ANE preferred Core ML .cpuAndNeuralEngine(ms) |
|---|---|---|---|---|
| YOLO26n | Detect | 640 | 9.2 0.0 / 9.2 / 0.0 | 3.2 0.0 / 3.2 / 0.0 |
| YOLO26n-seg | Segment | 640 | 12.6 0.0 / 12.0 / 0.5 | 4.8 0.0 / 4.2 / 0.6 |
| YOLO26n-sem | Semantic | 640 | 9.7 0.0 / 9.2 / 0.5 | 4.6 0.0 / 4.2 / 0.5 |
| YOLO26n-depth | Depth | 640 | 25.0 0.0 / 24.1 / 0.9 | 5.3 0.0 / 4.5 / 0.9 |
| YOLO26n-cls | Classify | 224 | 2.2 0.0 / 2.2 / 0.0 | 1.9 0.0 / 1.9 / 0.0 |
| YOLO26n-pose | Pose | 640 | 11.9 0.0 / 11.9 / 0.0 | 3.9 0.0 / 3.9 / 0.0 |
| YOLO26n-obb | OBB | 640 | 10.6 0.0 / 10.6 / 0.0 | 3.4 0.0 / 3.4 / 0.0 |
- The exact
v8.3.0release assets declare 224×224 inputs for classification and 640×640 for every other task. - Speed values are the mean of 15 runs after 3 warmup runs on bus.jpg,
measured through the SDK's per-stage timing (
YOLOResult.preMs/inferenceMs/postMs) in profile-mode builds (optimized native code).
From theexample/directory of the Flutter plugin, reproduce all seven task rows withflutter drive --profile -d <iphone> --driver=test_driver/integration_test.dart --target=integration_test/qnn_benchmark_test.dart --dart-define=RUN_BENCH=true. - These are single-image burst latencies, not sustained camera frame times: one sequential seven-task sweep on a
~0.9 MP photo, with CPU/accelerator order rotating between task rows and no live capture pipeline competing for the
accelerator. CPU rows request Core ML
.cpuOnly; CPU + ANE preferred rows request.cpuAndNeuralEngine, with final operation placement controlled by Core ML. A historical pre-standard sustained-camera sweep measured ~11.3 ms/frame for YOLO26n detect — see ⏱️ What the App's "Inference Time" Actually Measures and 📐 High-Resolution Preview, Model-Sized Inference for the steady-state pipeline breakdown. - The matching Snapdragon CPU/GPU/NPU table lives in the Flutter plugin performance guide.
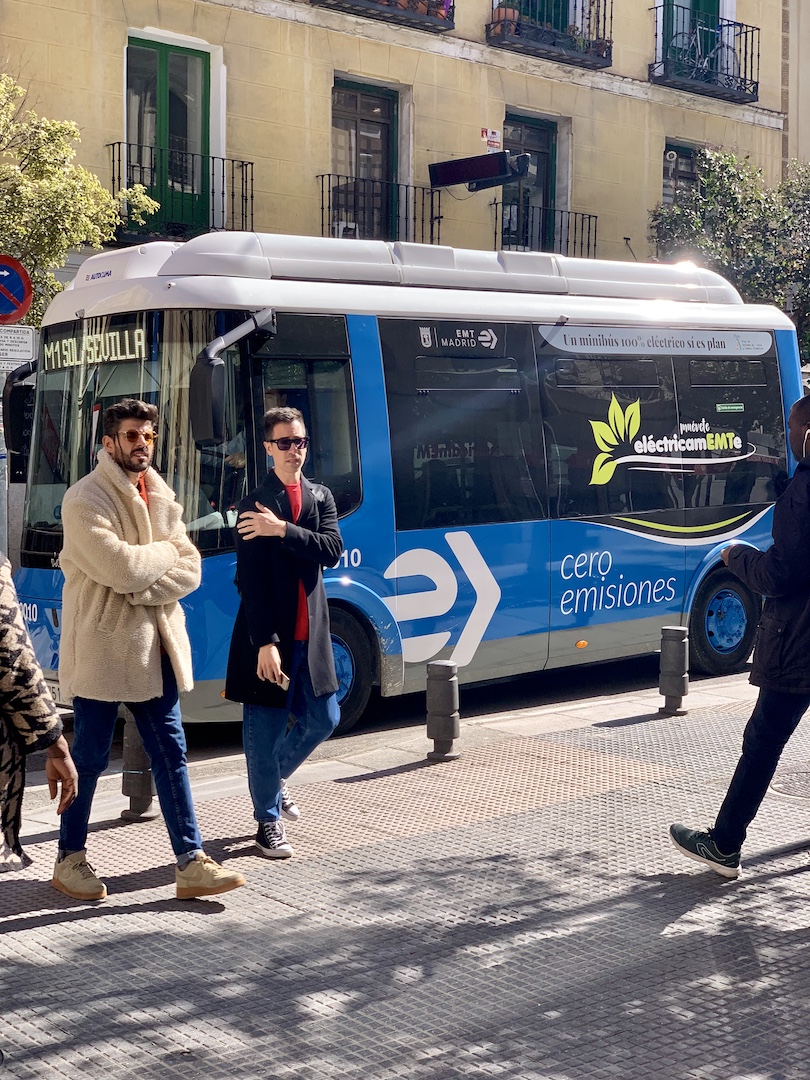
🍏 Core AI Backend
Core ML (.mlpackage) remains the default. Core AI (.aimodel) is an opt-in for iOS 27 and later devices: pass an
.aimodel path or an .aimodel.zip URL. It is not available on earlier iOS versions or in the iOS Simulator. This
section records the measured trade-offs behind that decision. The SDK loads an .aimodel through
CoreAIRequest.swift: it letterboxes the frame itself (Core Image render plus Accelerate BGRA → RGB CHW conversion,
centered exactly like Vision's .scaleFit, 114-gray padding) and hands the output tensors to the same task decoders
the Core ML path uses. useGpu: true means hardware acceleration: Core AI places the model across the Neural Engine,
GPU and CPU. useGpu: false pins it to the CPU. Both heads decode by output shape, so nothing in the SDK is tied to
one head.
On-Device Results
Apples-to-apples comparison on one device: every row is the same YOLO26n weights exported to a different format,
precision or head, run through the same SDK call (predictOnImage) on the same image. iPhone 17 Pro, iOS 27.0, Release
build, bus.jpg, imgsz 640 (224 for classify). Each value is the median of 3 interleaved rounds of 15 runs after 3
warmup runs, averaged over two cooled launches; a task's models are loaded together and timed in alternating rounds so
thermal drift and run order affect every row equally. Median run-to-run spread of inference time is 3%, worst case 17%,
so treat differences under about 10% as ties. The harness is in
#320. Times are milliseconds; Total is pre + inference + post
and is the number to compare, because Vision performs Core ML's preprocessing inside its inference time. ✅ marks the
official assets. "End-to-end" is the NMS-free head in the graph (nms=False); "raw head" is the package default
(nms=None) decoded by the SDK's Swift NMS.
Hardware acceleration (useGpu: true)
| Task | Model | Pre | Inference | Post | Total | Result on bus.jpg |
|---|---|---|---|---|---|---|
| Detect | Core ML INT8 end-to-end ✅ | 0.00 | 4.58 | 0.01 | 4.59 | 5 boxes, top 0.925 |
| Detect | Core ML FP16 end-to-end | 0.00 | 4.04 | 0.01 | 4.05 | 5 boxes, top 0.922 |
| Detect | Core ML FP16 raw head | 0.00 | 3.58 | 0.58 | 4.17 | 5 boxes, top 0.905 |
| Detect | Core AI FP16 end-to-end | 0.94 | 4.12 | 0.01 | 5.06 | 5 boxes, top 0.926 |
| Detect | Core AI FP16 raw head ✅ | 1.15 | 2.05 | 0.54 | 3.73 | 5 boxes, top 0.906 |
| Segment | Core ML INT8 end-to-end ✅ | 0.00 | 5.12 | 0.67 | 5.79 | 4 instances, top 0.920 |
| Segment | Core ML FP16 end-to-end | 0.00 | 4.60 | 0.64 | 5.24 | 4 instances, top 0.922 |
| Segment | Core ML FP16 raw head | 0.00 | 4.21 | 1.26 | 5.47 | 5 instances, top 0.870 |
| Segment | Core AI FP16 end-to-end | 0.99 | 5.54 | 0.60 | 7.13 | 4 instances, top 0.919 |
| Segment | Core AI FP16 raw head ✅ | 1.30 | 2.79 | 1.23 | 5.33 | 5 instances, top 0.873 |
| Semantic | Core ML INT8 ✅ | 0.00 | 4.60 | 0.35 | 4.95 | 12 classes |
| Semantic | Core ML FP16 | 0.00 | 4.52 | 0.34 | 4.86 | 12 classes |
| Semantic | Core AI FP16 ✅ | 1.29 | 3.47 | 3.79 | 8.55 | 12 classes |
| Depth | Core ML INT8 ✅ | 0.00 | 5.58 | 0.84 | 6.42 | depth 1.47–14.81 |
| Depth | Core ML FP16 | 0.00 | 5.79 | 0.82 | 6.62 | depth 1.47–15.03 |
| Depth | Core AI FP16 ✅ | 1.37 | 5.64 | 0.85 | 7.87 | depth 1.29–16.59 |
| Classify | Core ML INT8 ✅ | 0.00 | 1.97 | 0.01 | 1.98 | minibus 0.654 |
| Classify | Core ML FP16 | 0.00 | 2.32 | 0.02 | 2.34 | minibus 0.703 |
| Classify | Core AI FP16 ✅ | 0.68 | 0.51 | 0.01 | 1.19 | minibus 0.696 |
| Pose | Core ML INT8 end-to-end ✅ | 0.00 | 4.08 | 0.01 | 4.09 | 4 people, top 0.887 |
| Pose | Core ML FP16 end-to-end | 0.00 | 4.05 | 0.01 | 4.06 | 4 people, top 0.886 |
| Pose | Core ML FP16 raw head | 0.00 | 4.05 | 0.30 | 4.35 | 4 people, top 0.853 |
| Pose | Core AI FP16 end-to-end | 1.14 | 4.97 | 0.00 | 6.11 | 0 people (incorrect) |
| Pose | Core AI FP16 raw head ✅ | 1.40 | 2.31 | 0.31 | 4.02 | 4 people, top 0.857 |
| OBB | Core ML INT8 end-to-end ✅ | 0.00 | 3.79 | 0.00 | 3.79 | no aerial objects |
| OBB | Core ML FP16 end-to-end | 0.00 | 3.99 | 0.00 | 3.99 | no aerial objects |
| OBB | Core ML FP16 raw head | 0.00 | 3.92 | 0.41 | 4.33 | no aerial objects |
| OBB | Core AI FP16 end-to-end | 0.94 | 4.26 | 0.00 | 5.20 | no aerial objects |
| OBB | Core AI FP16 raw head ✅ | 1.27 | 1.97 | 0.41 | 3.65 | no aerial objects |
CPU only (useGpu: false)
| Task | Model | Pre | Inference | Post | Total | Result on bus.jpg |
|---|---|---|---|---|---|---|
| Detect | Core ML INT8 end-to-end ✅ | 0.00 | 11.50 | 0.01 | 11.51 | 5 boxes, top 0.926 |
| Detect | Core ML FP16 end-to-end | 0.00 | 10.25 | 0.01 | 10.26 | 5 boxes, top 0.925 |
| Detect | Core ML FP16 raw head | 0.00 | 10.21 | 0.58 | 10.79 | 5 boxes, top 0.904 |
| Detect | Core AI FP16 end-to-end | 1.15 | 21.30 | 0.01 | 22.45 | 5 boxes, top 0.926 |
| Detect | Core AI FP16 raw head ✅ | 1.15 | 17.49 | 0.60 | 19.25 | 5 boxes, top 0.902 |
| Segment | Core ML INT8 end-to-end ✅ | 0.00 | 14.79 | 0.77 | 15.56 | 5 instances, top 0.919 |
| Segment | Core ML FP16 end-to-end | 0.00 | 14.30 | 0.54 | 14.84 | 3 instances, top 0.919 |
| Segment | Core ML FP16 raw head | 0.00 | 13.82 | 1.29 | 15.11 | 5 instances, top 0.872 |
| Segment | Core AI FP16 end-to-end | 1.14 | 29.91 | 0.69 | 31.73 | 4 instances, top 0.916 |
| Segment | Core AI FP16 raw head ✅ | 1.17 | 25.53 | 1.31 | 28.02 | 5 instances, top 0.871 |
| Semantic | Core ML INT8 ✅ | 0.00 | 10.57 | 0.36 | 10.93 | 12 classes |
| Semantic | Core ML FP16 | 0.00 | 11.04 | 0.37 | 11.40 | 12 classes |
| Semantic | Core AI FP16 ✅ | 1.20 | 16.38 | 4.08 | 21.66 | 12 classes |
| Depth | Core ML INT8 ✅ | 0.00 | 30.74 | 0.90 | 31.64 | depth 1.44–12.34 |
| Depth | Core ML FP16 | 0.00 | 30.67 | 0.91 | 31.58 | depth 1.43–12.42 |
| Depth | Core AI FP16 ✅ | 1.21 | 36.95 | 0.91 | 39.07 | depth 1.26–14.10 |
| Classify | Core ML INT8 ✅ | 0.00 | 4.71 | 0.02 | 4.73 | minibus 0.795 |
| Classify | Core ML FP16 | 0.00 | 2.50 | 0.02 | 2.52 | minibus 0.689 |
| Classify | Core AI FP16 ✅ | 0.65 | 0.79 | 0.00 | 1.44 | minibus 0.684 |
| Pose | Core ML INT8 end-to-end ✅ | 0.00 | 14.45 | 0.01 | 14.46 | 4 people, top 0.887 |
| Pose | Core ML FP16 end-to-end | 0.00 | 14.92 | 0.01 | 14.93 | 4 people, top 0.886 |
| Pose | Core ML FP16 raw head | 0.00 | 14.09 | 0.33 | 14.42 | 4 people, top 0.856 |
| Pose | Core AI FP16 end-to-end | 1.16 | 21.91 | 0.01 | 23.08 | 4 people, top 0.886 |
| Pose | Core AI FP16 raw head ✅ | 1.17 | 21.18 | 0.34 | 22.69 | 4 people, top 0.856 |
| OBB | Core ML INT8 end-to-end ✅ | 0.00 | 13.18 | 0.00 | 13.18 | no aerial objects |
| OBB | Core ML FP16 end-to-end | 0.00 | 13.19 | 0.00 | 13.19 | no aerial objects |
| OBB | Core ML FP16 raw head | 0.00 | 13.30 | 0.42 | 13.72 | no aerial objects |
| OBB | Core AI FP16 end-to-end | 1.11 | 21.07 | 0.00 | 22.18 | no aerial objects |
| OBB | Core AI FP16 raw head ✅ | 1.17 | 19.68 | 0.41 | 21.25 | no aerial objects |
Findings:
- End to end, Core AI and Core ML are close. The official Core AI raw-head assets are ahead for detect (3.73 against 4.05–4.59 ms), OBB and classify, tied for segment and pose, and behind for semantic and depth.
- Core AI's model time is about half of Core ML's with the raw head (detect 2.05 against 3.58–4.58 ms inference), but about 1.2 ms of CPU preprocessing per frame and the Swift NMS give most of that back. Preprocessing is the next lever: Core ML gets it from Vision inside its inference time.
- Precision is not the difference. Core ML FP16 and INT8 are within noise of each other on this device, so the comparison with FP16 Core AI is fair; INT8 only halves the download.
- The raw head helps Core AI much more than Core ML. Core AI's end-to-end head pays a fixed
topkcost at the Neural Engine boundary (apple/coreai-torch#66), so its raw head is the official recipe:model.export(format="coreai", quantize=16, imgsz=640). - Semantic is slower on Core AI end to end (8.55 against 4.86–4.95 ms): its output is 4-D logits and the Swift argmax costs 3.8 ms, while the Core ML export emits a class map. Emitting the class map from the Core AI graph was tested and rejected: under hardware acceleration it returns a wrong map (class 0 on 200,317 pixels against about 84,000 in every other variant), while the same asset is correct on the CPU. Reported as apple/coreai-torch#116; the Swift argmax is tracked in #322.
- Depth is slower on Core AI by the preprocessing cost (7.87 against 6.42 ms); model time is equal. Tracked in #321.
- CPU only, Core AI is 1.5–2x slower than Core ML for every 640 task; only classify is faster.
- The FP16 end-to-end pose asset returns no detections under hardware acceleration (apple/coreai-torch#115); it is correct on the CPU, as FP32, and as the raw head, so the raw-head recipe avoids it.
- Swift NMS cost grows with object count. On
bus.jpgit is 0.3–1.3 ms. On a dense aerial OBB scene postprocessing reached 4.7 ms and the raw-head total 10.9 ms against 9.0 ms for Core ML. - Load time: the first load of an
.aimodelspecializes it once (0.6–3 s for nano, 2–7 s for the largest models); afterwards it loads from the system cache in tens of milliseconds, against a Core ML compile of about 1–2 s on every launch for a bundled.mlpackage. Switching between already-specialized Core AI models in the app is visibly faster than switching between Core ML models. - Stability: a 22,000-inference soak on the device did not reproduce apple/coreai-torch#75, and detect s/m/l/x plus the x model of every other task load and return correct results.
- Core AI assets are FP16 because the Ultralytics package has no int8 Core AI export; the shipped Core ML assets are INT8, so a Core AI asset is roughly twice the download size.
Two SDK fixes came out of these runs. The input tensor is allocated once and filled in bulk (NDArray(scalars:) copied
it element by element, about 55 ms per 640 × 640 frame). And a load that fails is retried once after evicting the
asset's specialization cache entries: on iOS 27.0 a stale entry (the asset was replaced under the same path, or the app
was reinstalled) fails the load in a few milliseconds with _GenericObjCError.nilError instead of being rebuilt, and
after AIModelCache.default.deleteEntries(for:) the same asset specializes again (0.4–1.5 s for nano) and loads
normally. Six of the seven official nano assets hit this after two days of reinstalls and recovered with the retry.
Hardware acceleration uses the default specialization options.
Prior Evidence
The Ultralytics package PR that added the export, ultralytics/ultralytics#25926, measured model time only (iPhone 17 Pro, iOS 27.0 beta 6, YOLO26n detect at 640, FP16, the same graph on both backends, input allocated outside the timed loop, three interleaved blocks of 50 iterations):
| YOLO26n detect, FP16 | Core AI | Core ML |
|---|---|---|
end2end head in the graph (nms=False) | 3.06 ms | 1.53 ms |
postprocess out of the graph (nms=None) | 1.32 ms | 1.32 ms |
The model body is at parity; the gap of the end-to-end head is one topk charged at the Neural Engine partition
boundary (apple/coreai-torch#66), which is why the raw head wins above. The same PR reports that some FP16
.aimodel assets abort the process while loading their Neural Engine program, inside Apple's runtime and before any
SDK code runs. The abort cannot be caught.
Official model IDs and bare bundle names always resolve to Core ML. An explicit .mlpackage path or URL loads
everywhere, while an explicit .aimodel requires iOS 27 or later on a device and throws
PredictorError.coreAIUnavailable otherwise.
🔬 Methodology (How to Reproduce)
| Tool | What it measures | Notes |
|---|---|---|
coremltools MLModel.predict per MLComputeUnit, subprocess-isolated, interleaved round-robin | host latency, relative deltas | Interleaving cancels thermal drift. ALL / CPU_AND_GPU predict crash the Mac host (MPSGraph compiler bug); only CPU_ONLY and CPU_AND_NE are usable host-side. |
MLComputePlan.load_from_path on a compiled .mlmodelc | per-op preferred device + estimated cost (ANE/GPU/CPU residency) | Static plan; the CPU cost share is not a wall-clock proxy. |
Xcode Core ML Performance Report (.mlpackage → Performance → device → All) | per-layer on-device compute-unit placement + prediction latency | Gold standard for absolute device numbers; exports *.mlperf/report.json. |
| Instrumented app build (experiment branch; these hooks are not in the shipped SDK) | per-frame preprocess / inference / postprocess split, EMA + raw jitter | Tap the FPS label to A/B Vision↔manual; env YOLO_PREPROCESS, YOLO_COMPUTE_UNITS, YOLO_CAMERA_PRESET; [perf] to stdout (capture via xcrun devicectl device process launch --console) and os_log (subsystem com.ultralytics.yolo, category YOLO). |
⏱️ What the App's "Inference Time" Actually Measures
The on-screen figure is the entire VNImageRequestHandler.perform per frame — preprocess + model predict + Swift postprocess — not just the model. The decode runs synchronously inside perform (the VNCoreMLRequest completion handler). On A19 Pro, the previous full-resolution .photo capture path measured:
| Stage | Time | Notes |
|---|---|---|
| Preprocess (camera buffer → 640 letterbox) | dominant | Detect test; cost scales with capture resolution — see below. |
| Model inference | ≈7 ms | In-app; vs ≈1.8 ms in the isolated Performance Report (thermal + live-pipeline contention). |
| Postprocess (Swift decode) | ≈0.18 ms | Raw-pointer reads; negligible. |
| Total | 15.9 ms | The frame time is the pipeline, not the model head. |
📷 Experiment: Camera Capture Resolution
Q: How much of the frame is preprocessing, and does capture resolution drive it? A: In this detect test,
.photo delivers full-sensor ~2 MP frames that are downscaled to the model's 640 input every frame — the dominant
cost. Lowering the capture preset has no model-input-resolution impact because the detect model still receives 640.
| Camera preset | Delivered frame | Preprocess | Frame time | FPS |
|---|---|---|---|---|
.photo (previous) | 1206×1608 | Vision | 15.9 ms | 15 |
.hd1280x720 | 720×1280 | Vision | 13.3 ms | 30 |
| 720p preview + 640 output (current) | 360×640 inference | Vision | 11.3 ms | 30 |
.vga640x480 | 480×640 | Vision | 13.3 ms | 24 |
.vga640x480 | 480×640 | manual | 8.3 ms | 25 |
Shipped: .hd1280x720 preview with a model-sized data output. The preview layer still receives the crisp 720p
session, while AVCaptureVideoDataOutput asks AVFoundation for only the pixels Vision will consume. The preset is
guarded by canSetSessionPreset with a [requested, .high, .photo] fallback so startup never regresses on a camera
that can't honor it.
📐 Experiment: High-Resolution Preview, Model-Sized Inference
Q: Can the app display 720p while sending a smaller frame to Vision? A: Yes. On iOS 16+, uncompressed
AVCaptureVideoDataOutput.videoSettings supports independent width and height. AVCaptureVideoPreviewLayer remains
attached directly to the 720p session; only the inference output is resized.
Historical optimized Release build, sustained live camera, same scene and pre-standard model binaries:
| Task | Model input | Inference buffer | Before | After | Change |
|---|---|---|---|---|---|
| Detect | 640 scale-fit | 360×640 | 13.3 ms | 11.3 ms | -15% |
| Segment | 640 scale-fit | 360×640 | 15.8 ms | 13.2 ms | -16% |
| Semantic | 1024 scale-fit | 576×1024 | 27.4 ms | 22.4 ms | -18% |
| Depth | 640 scale-fit | 360×640 | 18.3 ms | 16.5 ms | -10% |
| Classify | 224 center-crop | 224×398 | 8.1 ms | 7.8 ms | -4% |
| Pose | 640 scale-fit | 360×640 | 14.4 ms | 11.8 ms | -18% |
| OBB | 1024 scale-fit | 576×1024 | 26.8 ms | 24.1 ms | -10% |
The output dimensions come from the loaded model and Vision crop mode, preserve the active camera format's aspect
ratio, and never exceed the session's native buffer. iOS 13–15 keep the previous full-size output because those OS
versions only accept the pixel-format key. A dedicated AVCapturePhotoOutput requests the active format's largest
supported still image, runs inference on that exact photo so overlays remain aligned, and then creates the screen-sized
share composite while live inference continues on the smaller buffer. The device test captured and inferred on the
same 2376×4224 photo, then produced the expected 1206×2622-pixel composite.
🖼️ Experiment: Preprocessing — Vision vs. Manual vImage
Q: How much of the frame is Vision framework overhead vs. the model? A: Bypassing Vision with a manual vImage letterbox into a reused buffer fed directly to MLModel.prediction removes ~5 ms/frame of Vision overhead. (Device, yolo26n detect.)
| Path | Preprocess | Inference | Postprocess | Total |
|---|---|---|---|---|
Vision (.photo) | fused in vis (≈8 ms) | ≈7 ms (fused) | 0.18 ms | ≈16 ms |
Manual (.photo) | 6.7 ms | 7.0 ms | 0.16 ms | ≈13.4 ms |
Manual (.vga640x480) | 0.48 ms | 7.6 ms | 0.15 ms | ≈8.3 ms |
Manual preprocessing is ~10–15% faster on its own, and stacks with a small capture preset (VGA collapses the letterbox to 0.48 ms → ~8 ms total). It is not shipped: it is currently detect-only and its BGRA→model color order needs visual validation. Preserved as an experiment (git stash).
🎨 Experiment: Segment Mask Painting
Q: Can high-resolution instance masks stay sharp without making segment postprocess dominate camera latency? A: Yes. Keep the high-resolution mask path, but make the final color paint pass pointer-based.
Device (YOLO26n-seg, live camera, iPhone 17 Pro):
| Segment mask paint path | Postprocess |
|---|---|
| Per-detection UIColor lookup + Swift array writes | ≈10 ms |
| Precomputed color words + pointer ROI paint | ≈3 ms |
The shipped path still scales Float mask logits before thresholding, so mask edges remain high-resolution. The win comes from removing repeated UIColor component extraction and bounds-checked Swift array writes from the per-pixel ROI sweep.
🌡️ Experiment: Depth Map Painting
Q: Can a full-resolution depth map be colorized every camera frame without dominating latency? A: Yes. Apply the
same Accelerate pattern as semantic segmentation: bulk-copy contiguous tensor rows, use vDSP/vForce for min/max and
log normalization, then paint through Planar8 lookup tables and vImageConvert_Planar8toARGB8888.
Device (YOLO26n-depth, 640×640 int8 Core ML, live 720p camera, Debug build, 360×640 map after letterbox crop):
| Depth color path | Postprocess |
|---|---|
| Per-pixel Swift log + color-stop interpolation | ≈70 ms |
| Accelerate/vImage vectorized paint | ≈2.1 ms |
The vectorized path preserves the public metric-depth array and the same near-to-far color gradient; it only replaces the scalar rendering sweep.
Single-image burst latency across every official Depth size on the same iPhone 17 Pro (15 runs after 3 warmups,
bus.jpg, profile-mode Flutter harness, 480×640 typed metric map):
| Depth model | CPU inference | CPU post | CPU total | CPU + ANE preferred inference | Preferred post | Preferred total |
|---|---|---|---|---|---|---|
| YOLO26n | 23.90 ms | 0.85 ms | 24.75 ms | 4.67 ms | 0.87 ms | 5.54 ms |
| YOLO26s | 33.67 ms | 0.90 ms | 34.57 ms | 6.15 ms | 0.85 ms | 7.01 ms |
| YOLO26m | 55.27 ms | 0.93 ms | 56.21 ms | 9.64 ms | 0.89 ms | 10.54 ms |
| YOLO26l | 67.32 ms | 0.93 ms | 68.25 ms | 10.87 ms | 0.94 ms | 11.80 ms |
| YOLO26x | 116.77 ms | 0.94 ms | 117.71 ms | 19.38 ms | 0.93 ms | 20.30 ms |
Vision performs scaling inside the request, so preprocessing is reported as 0 and included in inference. These burst numbers are distinct from the sustained 16.5 ms/frame YOLO26n Depth camera result above.
🧠 Experiment: Core ML Compute Units (CPU / GPU / ANE)
Q: Should inference use .cpuAndNeuralEngine or .all (adds GPU)? A: .all is no faster and slightly jitterier in a live camera app, where the GPU is busy compositing the preview/overlays. The model is ~7 ms in-app under both.
Device, yolo26n detect, 4-cell matrix (raw = un-smoothed per-frame ms):
| Preprocess | Compute units | Model inf | Total | Raw min/p90/max |
|---|---|---|---|---|
| Vision | .cpuAndNeuralEngine | fused | 16.0 ms | 13.2/17.3/17.8 |
| Vision | .all | fused | 16.4 ms | 12.7/17.6/18.8 |
| Manual | .cpuAndNeuralEngine | 6.95 ms | 14.0 ms | 10.7/15.0/18.5 |
| Manual | .all | 6.80 ms | 13.0 ms | 11.0/13.9/16.8 |
Host (coremltools, yolo26n): CPU_AND_NE 2.6 ms vs CPU_ONLY 8.6 ms — the ANE is ~3× faster than CPU. (GPU-only is not measurable host-side; ALL/CPU_AND_GPU crash the Mac.)
The same applies to the Ultralytics Python package on a Mac: its CoreML backend defaulted to ComputeUnit.ALL, so YOLO("model.mlpackage").predict() crashed on macOS hosts. Fixed in ultralytics#24885 — it now loads CPU_AND_NE (ANE, ~3× faster; CPU_ONLY fallback on macOS <13), so host inference and val() run on the Neural Engine out of the box.
Shipped: .cpuAndNeuralEngine — keeps the conv backbone on the ANE and avoids GPU contention. Do not switch to .all.
🎯 Experiment: YOLO26 End2end Head vs. Legacy Head + NMS
Export arguments below use the equivalent nms settings from Ultralytics >=8.4.142.
Q: The YOLO26 in-graph end2end decode (top-k/gather, no NMS) puts some ops on the CPU — is it slower than a legacy head + Core ML/Vision NMS? A: On host it looks slower; on device it is as fast or faster. Keep end2end.
Host (coremltools NE median, interleaved, yolo26n):
Variant (yolo26n) | NE latency | ANE op-share |
|---|---|---|
end2end (nms=False, shipped) | 2.60 ms | 92.9% |
legacy raw (nms=None) | 2.26 ms | 99.3% |
legacy + Core ML NMS (nms=True) | 2.37 ms | (pipeline) |
Host end2end penalty vs legacy+NMS: n +9.4%, s +6.4%, m +3.9% (fixed ~0.25 ms CPU decode cost, so a larger % on smaller models). Compute plan: end2end adds ~19 CPU ops (top-k/gather/decode), dropping ANE op-share 99.3%→92.9%.
Device (Xcode Performance Report, A19 Pro, yolo26n):
| Variant | Median | Min | CPU ops | ANE ops |
|---|---|---|---|---|
| end2end | 1.81 ms | 1.52 ms | 21 | 276 |
| legacy + NMS | 1.90 ms | 1.76 ms | 2 | 282 |
On device the sign flips: end2end is faster — the A19 Pro ANE runs the in-graph top-k cheaper than a separate Vision NMS stage. The 21 CPU ops are real but cheap. Re-exporting with nms=None for speed is a no-op-to-loss on device, and would force Swift-side NMS for OBB/pose/seg. The app export script keeps nms=False; the Ultralytics export default is nms=None.
📦 Experiment: Core ML Export Variants
Fresh yolo26n exports from the sibling Ultralytics checkout were installed into the optimized app and measured with
the model-sized inference buffer. Reference-image results use bus.jpg at the existing 0.25 confidence threshold.
| Export | Device total | Package | Reference result | Decision |
|---|---|---|---|---|
| INT8 end2end, 640 (current) | 11.5–12.0 ms | 2.6 MB | 5 boxes; top confidence 0.925 | Keep |
| FP16 end2end, 640 | 11.4–11.6 ms | 4.8 MB | 5 boxes; top confidence 0.922 | Within thermal/run noise; 2× size |
| INT8 end2end, 480 | 9.9–10.3 ms | 2.6 MB | 6 boxes; top confidence 0.872 | Faster, but visibly weaker scores/extra detection |
| INT8 legacy raw, 640 | 12.8–13.0 ms | 2.6 MB | 5 boxes | Rejected: Swift NMS adds ≈2.4 ms |
| INT8 Core ML/Vision NMS, 640 | 11.2–11.7 ms | 2.6 MB | 5 boxes | No repeatable win over end2end |
The 480 export is the only material inference-side speed lever, but it changes model quality and therefore is not a drop-in optimization. FP16 and Vision NMS do not justify replacing the current release assets. The existing INT8 end2end export remains the best size/speed/quality default.
🆚 Experiment: YOLO26 vs. YOLO11 Backbone
Q: Is the YOLO26 backbone slower than YOLO11 on Core ML? A: No — they're equal. Host (coremltools NE, raw heads): yolo26n 2.26 ms ≈ yolo11n 2.25 ms (and yolo26n is smaller, 2.71 vs 2.89 MB). Any "YOLO26 is slower" impression was the end2end head, not the backbone.
⚖️ Experiment: Quantization & Deployment Target
| Setting | Effect |
|---|---|
| int8 (8-bit palettization, shipped) | ~½ model size, no latency change (ANE computes fp16; weights decompress at load). Size win only. |
| int8 activation quantization | No benefit (the ANE is fp16-native). |
minimum_deployment_target iOS17/18+ | Regresses detect latency (adds casts / CPU ops). Leave unset; let coremltools choose. |
🎞️ Frame Rate Is Camera-Bound, Not Inference-Bound
FPS is the rate the camera delivers and the pipeline processes frames — not 1000 / inference_ms. At ≤13 ms/frame the pipeline finishes well inside the camera's frame interval and idles until the next frame. Proof: manual+VGA (8.3 ms) ran at a lower FPS than Vision+720p (13.3 ms). The cap is set by the camera format (~30 fps default), reduced in dim light (auto-exposure lengthens frame duration) and under thermal load — and the SDK does not raise activeVideoMinFrameDuration. Faster inference therefore buys latency and power/thermal headroom, not FPS, unless the camera frame-rate cap is raised.
📐 Aspect-Ratio Robustness (16:9 ↔ 4:3)
Capture presets differ in aspect (.photo/.vga640x480 are 4:3, .hd1280x720 is 16:9), so letterbox bars fall on different axes. For the tested 640 detect model, letterboxTransform derives gain = min(640/W, 640/H) with independent centered padX/padY from the live frame size; inputRect inverts it; and on-screen overlays use aspect-fill mapping consistent with the preview's .resizeAspectFill gravity. The same transform uses each loaded model's dimensions. Verified by Tests/YOLOTests/LetterboxTests.swift (round-trips both aspects in both orientations).
✅ Shipped Configuration
.hd1280x720 preview · model-sized inference output · high-resolution photo capture · .cpuAndNeuralEngine · INT8
YOLO26 Core ML models · Vision preprocessing · optimized high-resolution segment/depth painting · default
minimum_deployment_target. Core AI is opt-in only (Core AI Backend).
On A19 Pro, frame time is dominated by model inference plus Vision's fused scaling. The isolated Performance Report's ~1.8 ms model time is not achievable inside a sustained live camera pipeline.
🔓 Open Levers (Untested / Not Shipped)
-
In-graph ArgMax for semantic models.Shipped (ultralytics/ultralytics#24790 + #24799 + this SDK'sSemanticSegmenterclass-map support): semantic Core ML exports now embed the ArgMax and return a full-resolution[1, H, W]class map, replacing the CPU argmax decode with a sub-millisecond color sweep and making masks pixel-sharp. The same recipe is QNN/Core ML-only: the LiteRT GPU delegate cannot compileARG_MAX(whole-graph CPU fallback measured 3.6× slower than GPU logits), so Android LiteRT keeps consumer-side argmax. -
Cross-platform decode parity (context, not a lever). The Flutter Android predictors previously spent ~12 ms/frame on detect decode (tensor reshape copies + JNI marshaling); rewriting them to direct flat reads — the approach this SDK has always used via raw pointers (~0.18 ms) — took Android detect from 23.3 to 13.1 ms end-to-end. Validation that the raw-pointer decode pattern here is the right baseline and should be preserved in any future refactor.
-
Lower model input resolution.Tested atimgsz=480: ≈2 ms faster, but lower reference confidences and an extra detection. Not shipped because it is an accuracy/quality setting, not a free optimization. -
Manual vImage preprocessing — the historical full-resolution experiment saved ~5 ms/frame, but the shipped model-sized capture output now removes much of that resize work while retaining Vision. Any remaining benefit needs a fresh all-task comparison plus BGRA color-order validation before replacing the current path.
-
Higher camera frame rate — raise
activeVideoMinFrameDurationtoward 60 fps where the format and lighting allow, now that inference has headroom. -
Frame skipping — process every Nth frame to cut sustained power/thermal in always-on use.