README-en.md
October 21, 2019 · View on GitHub
![]()
![]()

![]()
![]()
![]()
![]()
Introduction
Vim-EasyDebugger is yet another debugger frontend plugin for Vim. It's based on VIM 8.1 and support multi-language. It has been tested with NodeJS, Python, Go (Node inspect, and Delve). Some other debugger plugins are too difficult to configure and most of them are no longer maintained today. So I redesign it. I did'nt want to use any DBGP protocol such as Xdebug because I think it's not easy to accomplish minimalist experience that I want. Anyway, Thanks to VIM 8.1, Terminal features is powerful enough for me and the development experience is cool.
Vim-EasyDebugger has a nicer interface to be easily extended. You can add your favourite debugger toolkit. By default EasyDebugger currently support:
- Tracking in the source code
- Debugger flow commands - step-in, step-over, step-out and continue...
- Breakpoints management
- Evaluating expressions in the current context, watch expression and variable values while debugging.
- Backtrace and localvars
Installation
Requirements:
- VIM 8.1 with terminal support.
- Debugger such as Node inspect, Delve, and PDB
Installation:
With Pathogen.vim, Execute the following commands:
cd ~/.vim/bundle/
git clone https://github.com/jayli/vim-easydebugger
With Vundle.vim: add the following code into .vimrc. And run :PluginInstall in VIM
Plugin 'jayli/vim-easydebugger'
Configuration
Commands:
InspectInit/Debugger: startup debuggerWebInspectInit: startup Chrome DevTools debug serviceInspectCont: continueInspectNext: stepoverInspectStep: stepinInspectOut: stepoutInspectPause: pauseInspectExit/ExitDebugger: exitLocalvarWindow:open localvar windowStackWindow:open stack windowBreakPointSetting: set or delete break point
My key maps in ~/.vimrc
" Debugger startup
nmap <S-R>	<Plug>EasyDebuggerInspect
nmap <S-W>	<Plug>EasyDebuggerWebInspect
nmap <S-E>	<Plug>EasyDebuggerExit
" pause
nmap <F6>	<Plug>EasyDebuggerPause
tmap <F6>	<Plug>EasyDebuggerPause
" stepout
nmap <F7>	<Plug>EasyDebuggerStepOut
tmap <F7>	<Plug>EasyDebuggerStepOut
" stepinto
nmap <F8>   <Plug>EasyDebuggerStepIn
tmap <F8>   <Plug>EasyDebuggerStepIn
" next
nmap <F9>	<Plug>EasyDebuggerNext
tmap <F9>	<Plug>EasyDebuggerNext
" Continue
nmap <F10>	<Plug>EasyDebuggerContinue
tmap <F10>	<Plug>EasyDebuggerContinue
" break or delete break
nmap <F12>	<Plug>EasyDebuggerSetBreakPoint
define openning localvar window: <Plug>EasyDebuggerLocalvarWindow,define openning call stack window: <Plug>EasyDebuggerStackWindow
Key-Maps:
- Shift-R :startup debugger
- Shift-E :quit debugger
- Shift-W :startup Chrome DevTools debug service
- F6 :pause
- F7 :stepout
- F8 :stepin
- F9 :stepover
- F10 :continue
- F12 :toggle line breakpoint
Useage
How to..
debug mode
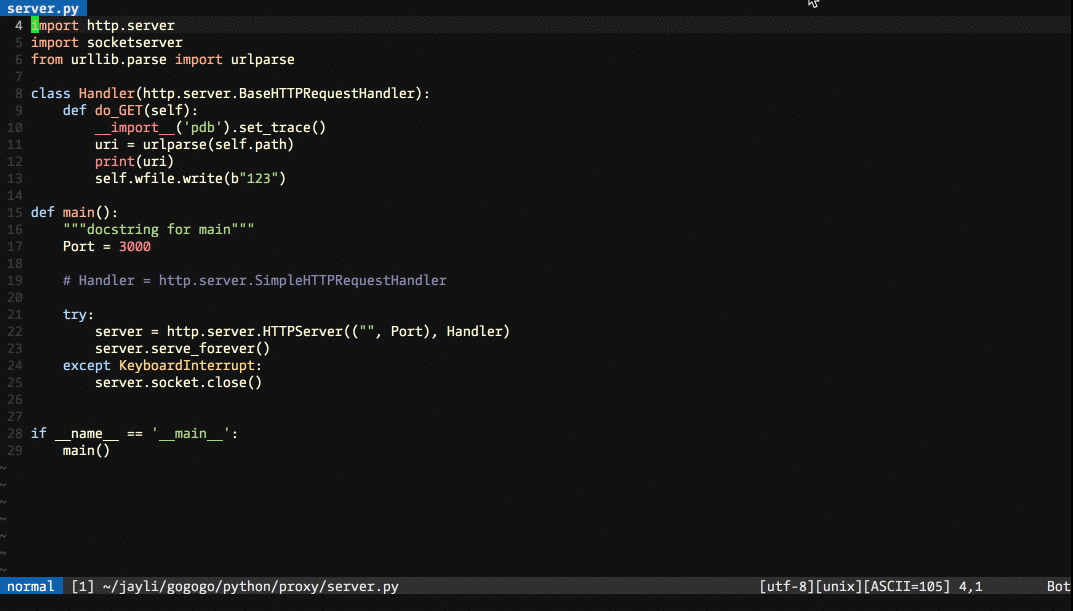
Press Shift-R (or :Debugger) to startup debugger with node inspect (dlv debug for golang, python3 -m pdb for python3) running in terminal. If you want to start with another file. You can set debugger_entry in top of your source code like this:
For Python:
# debugger_entry = ../index.py
For Go and JavaScript
// debugger_entry = ../index.go
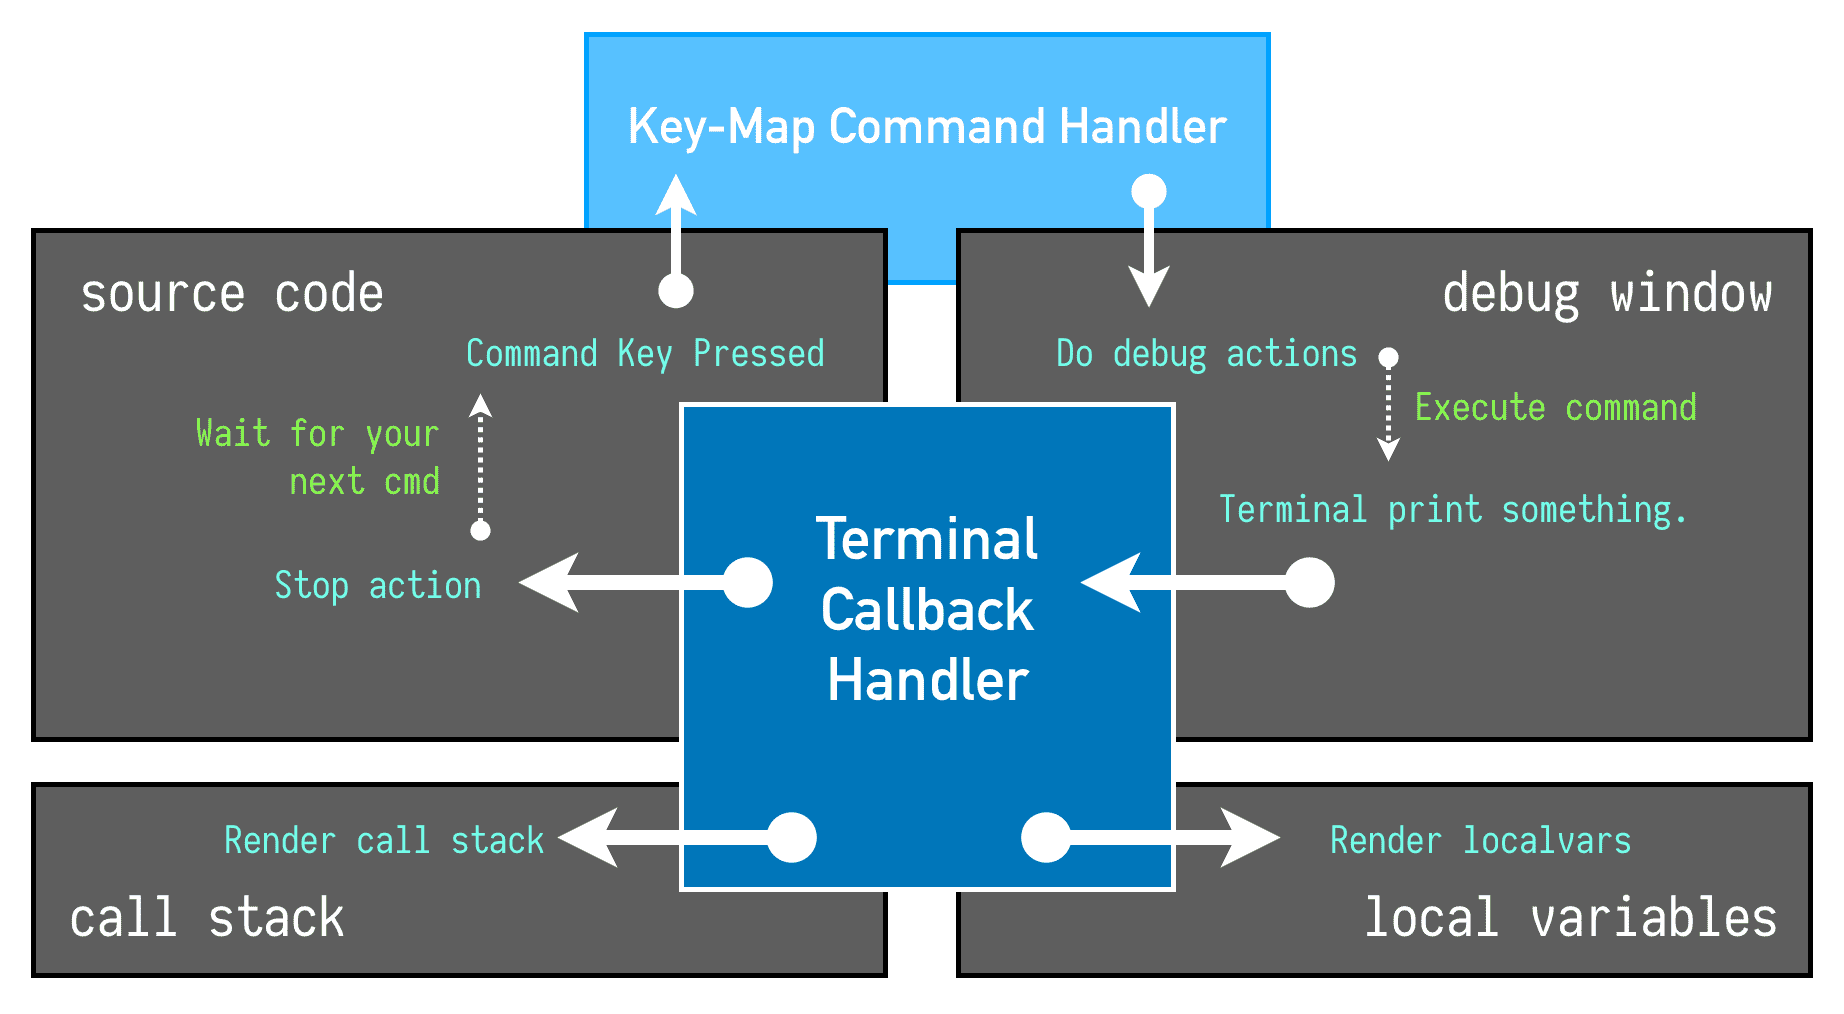
Debug mode windows:
 _______________________________________________________________
|                               |                               |
|                               |                               |
|                               |                               |
|        Source Window          |         Debug Window          |
|    g:debugger.original_winid  |     g:debugger.term_winid     |
|                               |                               |
|                               |                               |
|_______________________________|_______________________________|
|                               |                               |
|          Call Stack           |        Local Variables        |
|    g:debugger.stacks_winid    |   g:debugger.localvars_winid  |
|_______________________________|_______________________________|
Type next + Enter in Terminal means step over. If you want to quit debug, input exit + Enter in terminal, or :exit (or Shift-E) in source code window. You can input Ctrl-w N(Ctrl-w, Shift-N)in terminal window if you want to get more output log. Type i to go back for interactive terminal.
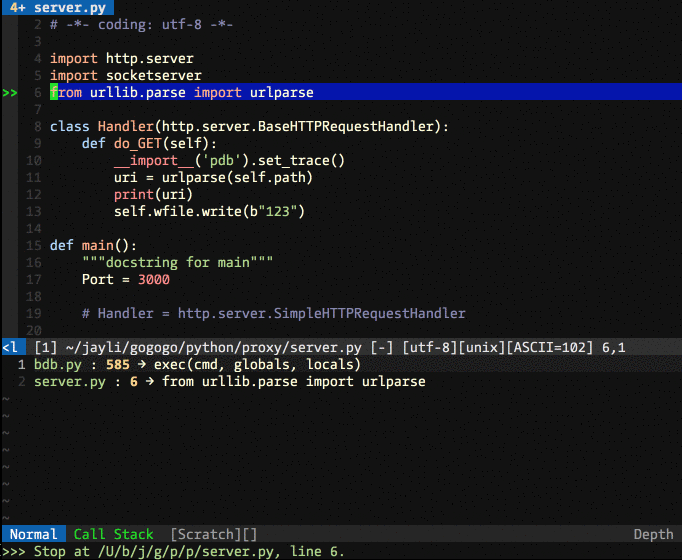
Press F12 (or :BreakPointSetting) to toggle break points.
Open call stack window or localvars window:

Set break point:
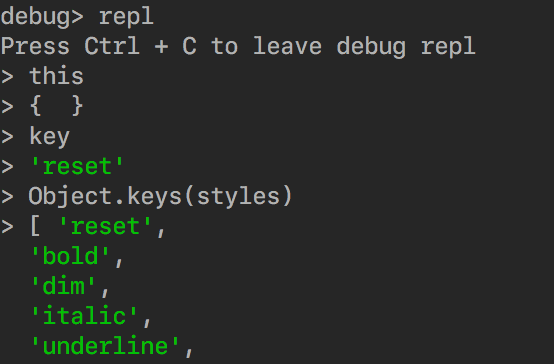
How to inspect local variables?
- NodeJS: Type
replin terminal. Go go the REPL mode and then input variable name . Such as below. - Golang: Type
print {variable}orlocals -v {variable}. - Python: Type
pp {variable}
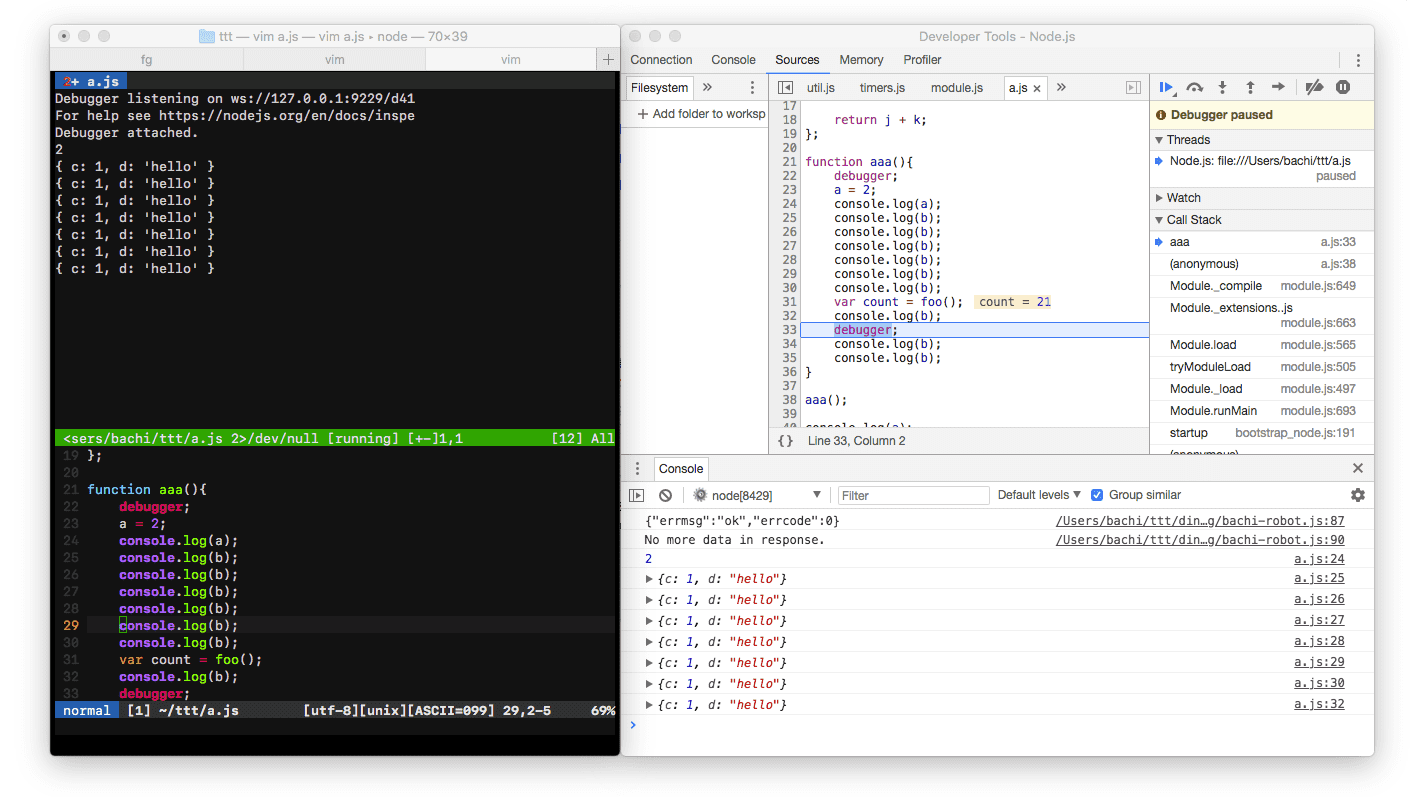
Chrome DevTools Debug for NodeJS
You can use chrome devtool for nodejs debug. Press Shift-W . Then connect it to chrome devtool like this.
Licence
This plugin is released under the MIT License.
Author: Jayli