Datetime Plots
December 19, 2023 · View on GitHub
Introduction
-
Plotting dates or times simply requires passing a list of date-time string objects (such as
"01/01/2000","12:30:32"or"01/01/2000 12:30:32") to the plotting functions. -
To control how
plotextinterprets string as date-time objects use thedate_form()method, where you can change its:-
input_formparameter to control the form of date-time strings inputted by the user, -
output_formparameter to control the form of date-time strings outputted byplotext(by default equal toinput_form), including outputted axes date-time ticks.
-
-
The date-time string forms are the standard ones, with the
%symbol removed for simplicity; eg:d/m/Y(by default), ord/m/Y H:M:S. -
If needed, most of the functions that follow allow to optionally set their input and output forms independently, with their correspondent parameters, overwriting the
date_form()settings.
-
To get today in
datetimeor string form usetoday_datetime()andtoday_string()respectively. -
To turn a
datetimeobject into a string usedatetime_to_string()ordatetimes_to_strings()for a list instead. -
To turn a string into a
datetimeobject usestring_to_datetime(). -
To turn a string to a numerical time-stamp use
string_to_time()andstrings_to_time()for a list of strings. -
The method
set_time0()sets the origin of time to the string provided; this function is useful inlogscale, in order to avoid hitting the 0 time-stamp.
Datetime Plot
To plot dates and/or times use either plt.scatter() or plt.plot() functions directly.
Here is an example, which requires the package yfinance:
import yfinance as yf
import plotext as plt

plt.date_form('d/m/Y')

start = plt.string_to_datetime('11/04/2022')
end = plt.today_datetime()
data = yf.download('goog', start, end)

prices = list(data["Close"])
dates = plt.datetimes_to_string(data.index)

plt.plot(dates, prices)

plt.title("Google Stock Price")
plt.xlabel("Date")
plt.ylabel("Stock Price $")
plt.show()
or directly on terminal:
python3 -c "import yfinance as yf; import plotext as plt; plt.date_form('d/m/Y'); start = plt.string_to_datetime('11/04/2022'); end = plt.today_datetime(); data = yf.download('goog', start, end); prices = list(data['Close']); dates = plt.datetimes_to_string(data.index); plt.plot(dates, prices); plt.title('Google Stock Price'); plt.xlabel('Date'); plt.ylabel('Stock Price $'); plt.show()"
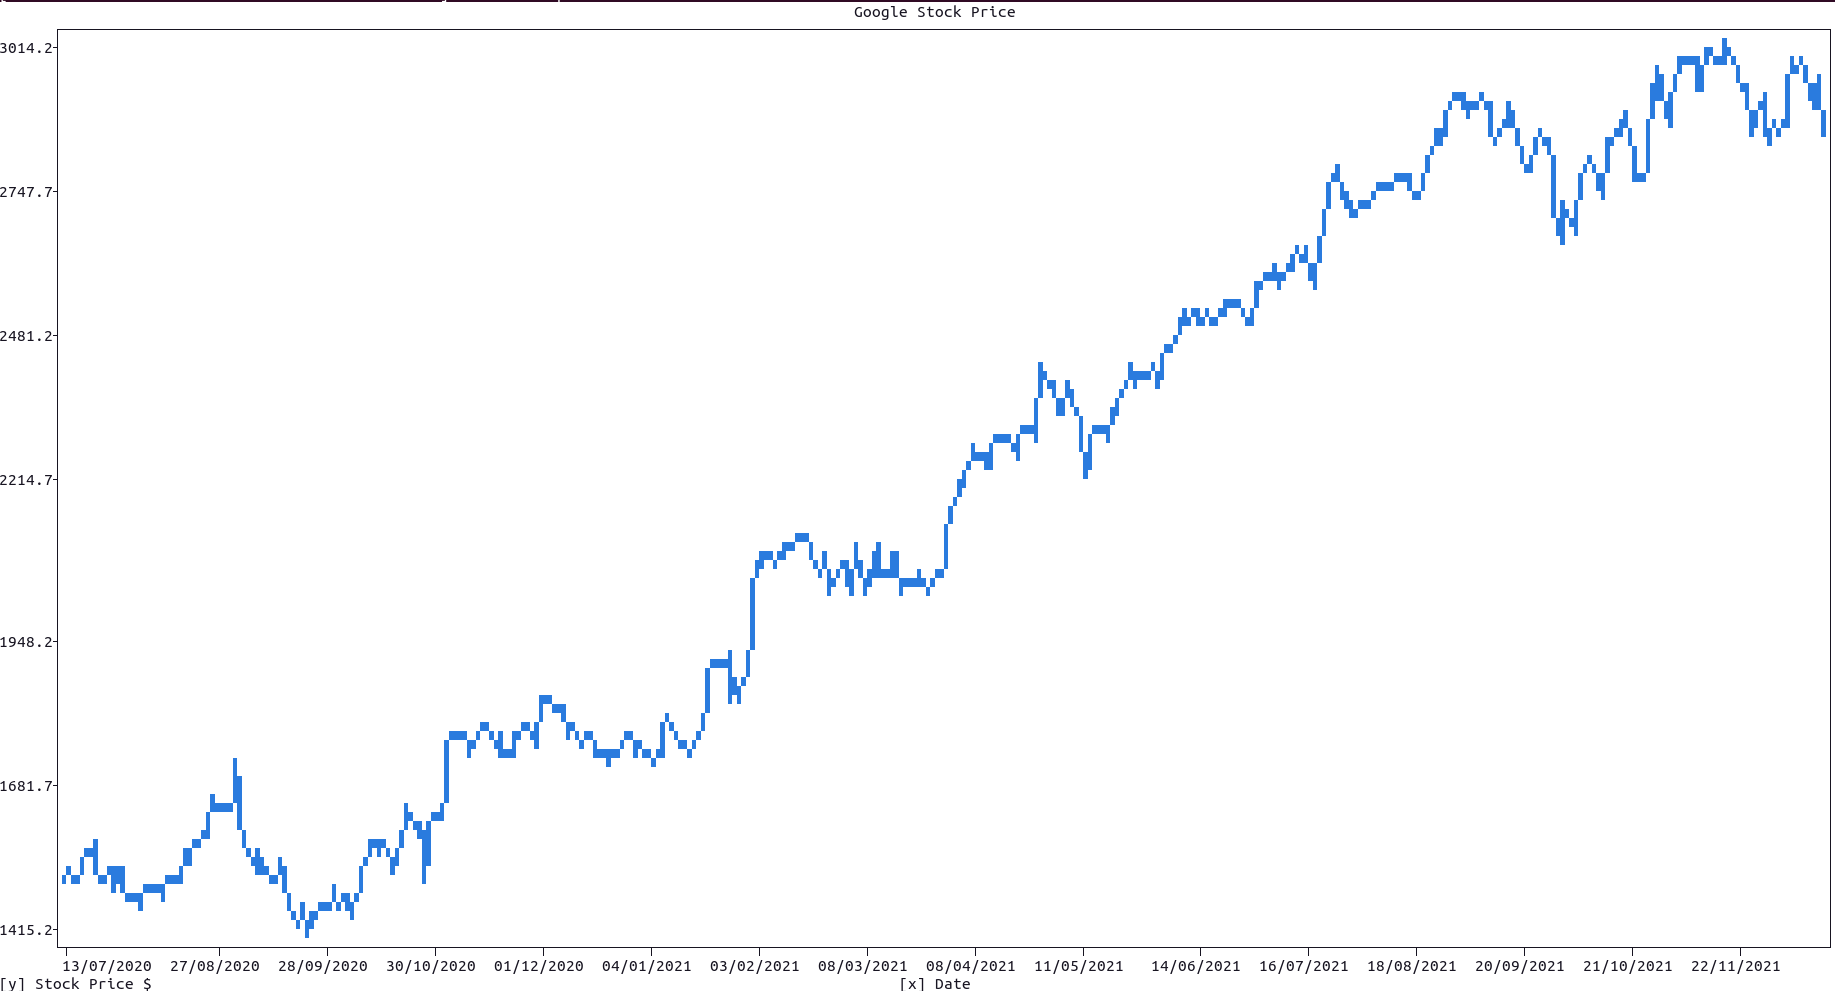
Note that you could easily add text and lines to the plot, as date-time string coordinates are allowed in most plotting functions.
Candlestick Plot
For this kind of plot, use the function candlestick(), which requires a list of date-time strings and a dictionary with the following 'Open', 'Close', 'High', and 'Low' mandatory keys, and where each correspondent value is a list of prices.
Here is an example, which requires the package yfinance:
import yfinance as yf
import plotext as plt

plt.date_form('d/m/Y')

start = plt.string_to_datetime('11/04/2022')
end = plt.today_datetime()
data = yf.download('goog', start, end)

dates = plt.datetimes_to_string(data.index)

plt.candlestick(dates, data)

plt.title("Google Stock Price CandleSticks")
plt.xlabel("Date")
plt.ylabel("Stock Price $")
plt.show()
or directly on terminal:
python3 -c "import yfinance as yf; import plotext as plt; plt.date_form('d/m/Y'); start = plt.string_to_datetime('11/04/2022'); end = plt.today_datetime(); data = yf.download('goog', start, end); dates = plt.datetimes_to_string(data.index); plt.candlestick(dates, data); plt.title('Google Stock Price Candlesticks'); plt.xlabel('Date'); plt.ylabel('Stock Price $'); plt.show()"
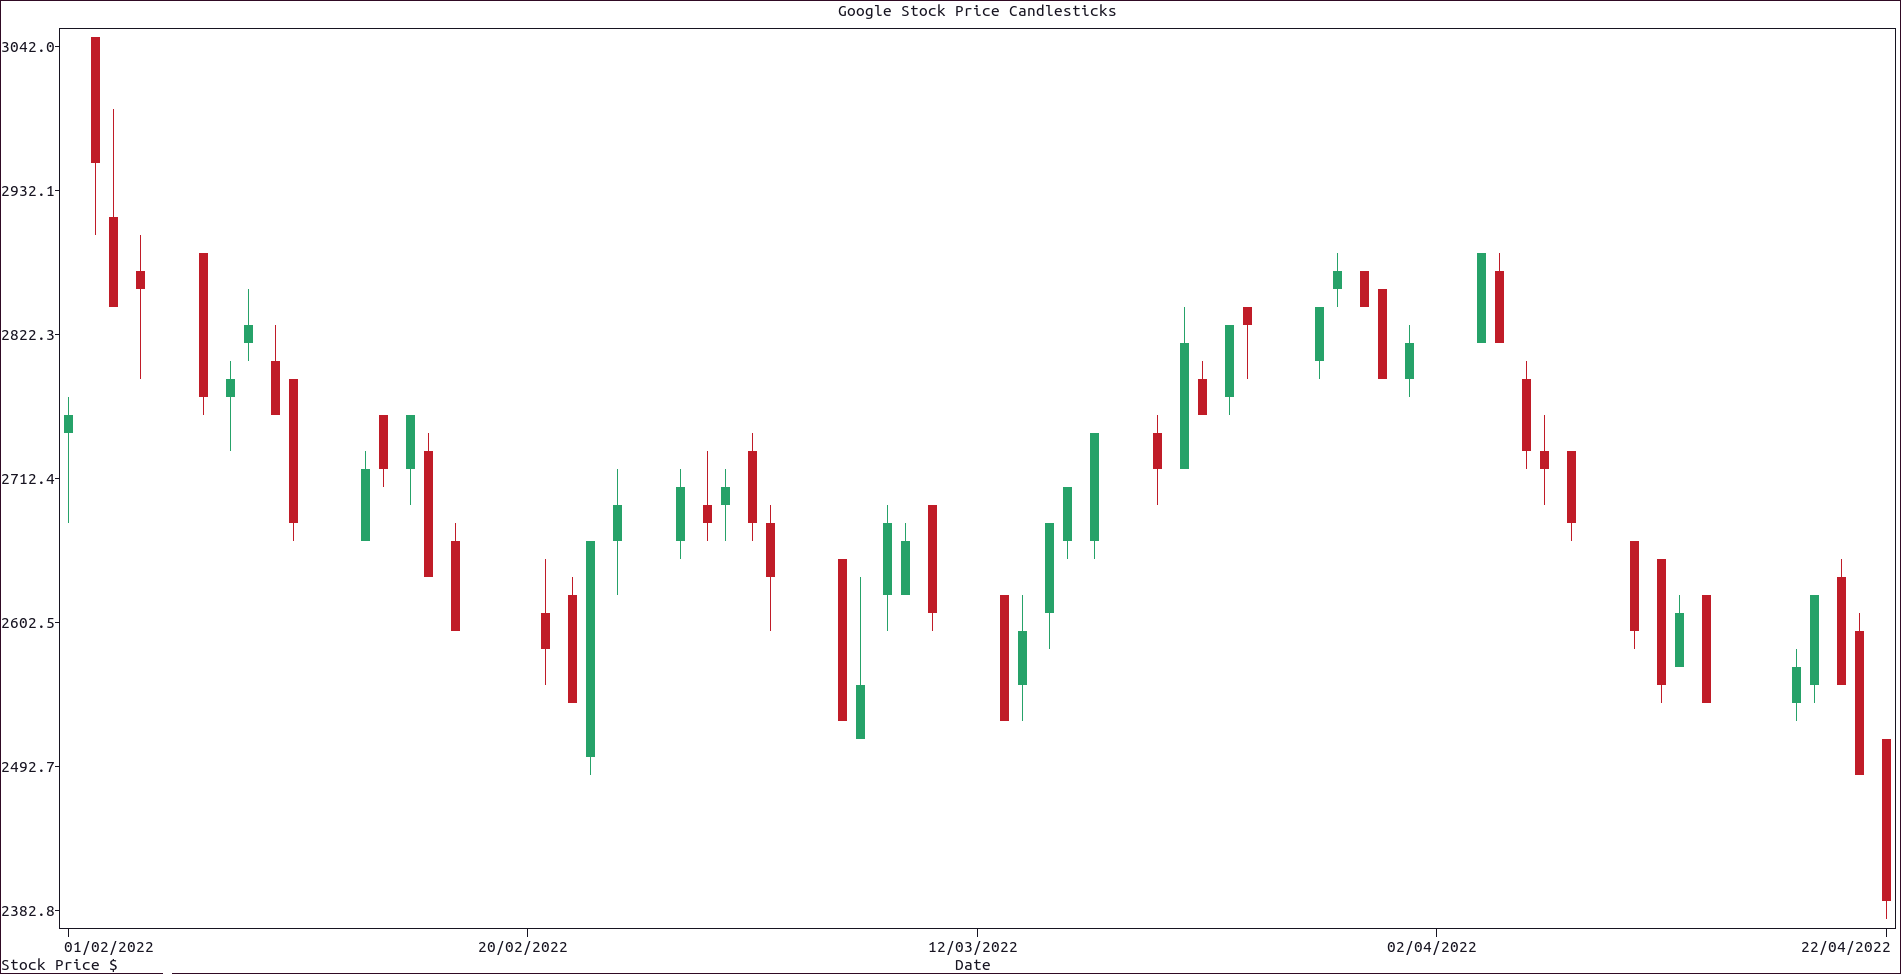
More documentation can be accessed with doc.candlestick().